B1 — First screen and 300-epoch comparison
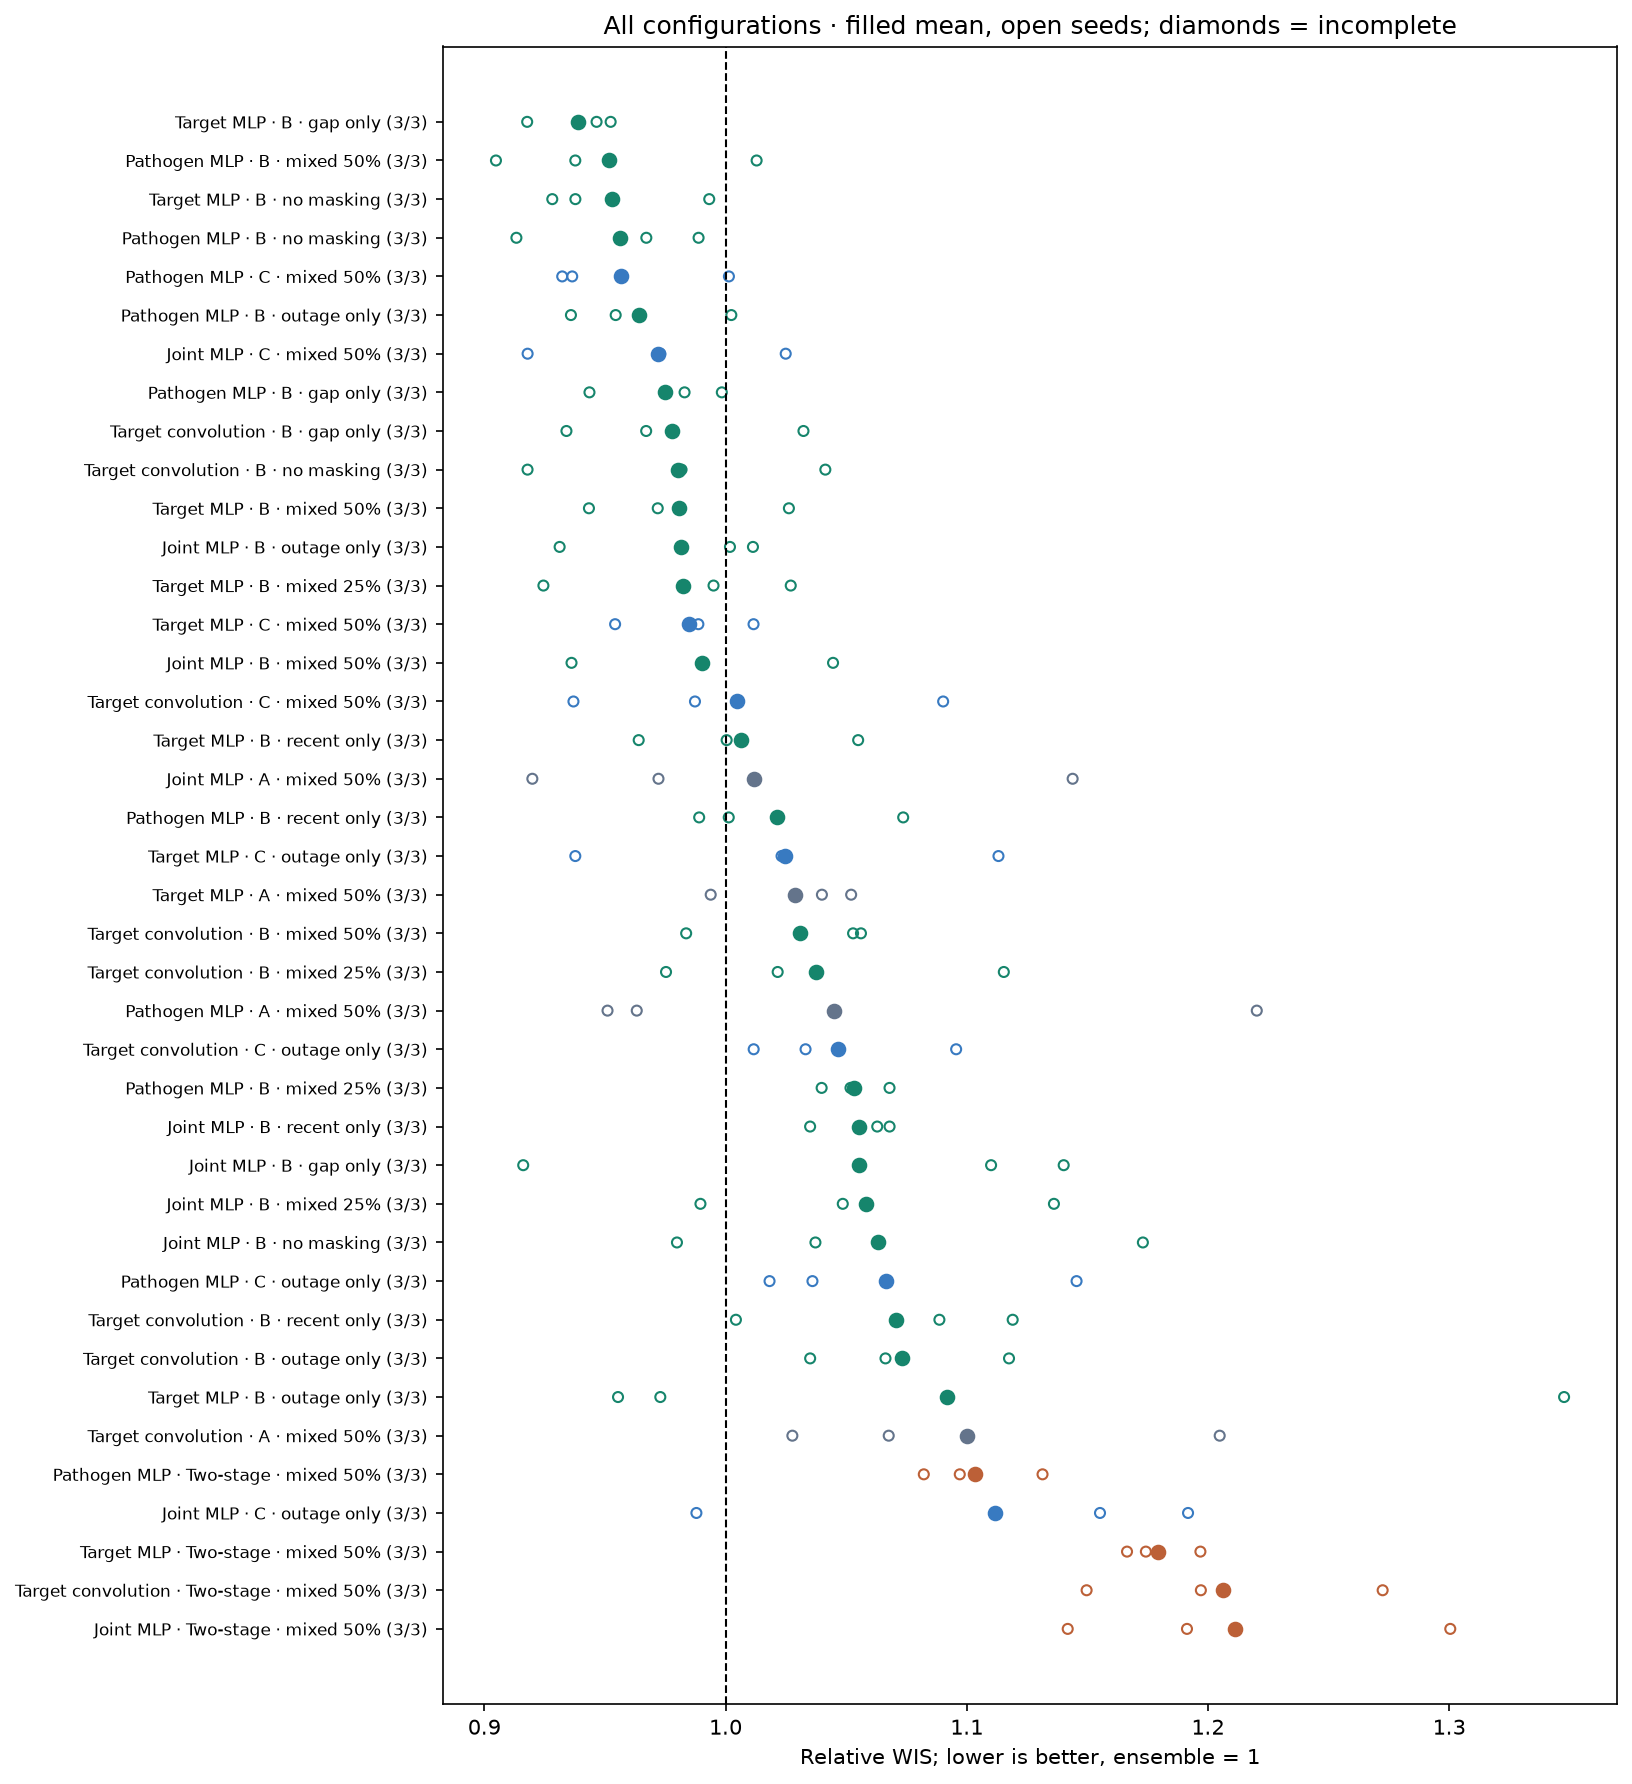
15 of 40 configurations beat the Hub ensemble on the combined forecast score. The leading configuration is Target MLP · B · gap only, at 0.939 (6.1% lower relative WIS). These headline numbers describe the original overnight screen. The separate 300-epoch comparison is reported below.
300-epoch results and comparison
48/48 runs complete, generated 2026-09-17T22:20-04:00. This is a dated snapshot. The follow-up contains 16 configurations (four architectures × four formulations), all at mixed 50% masking, with seeds 42/43/44. Caps are maxima with patience 30, not fixed epoch counts. The original screen below also includes masking variants that were not repeated here, including its gap-only winner.
Ranking at cap 300
4/16 available configuration means beat the ensemble. Lower relative WIS is better; 1 is ensemble parity. Each seed is a complete three-season run. Incomplete configurations retain their seed counts; missing runs are not imputed.
| Configuration | Seeds / 3 | WIS ratio | Seed SD | States/DC | US |
|---|---|---|---|---|---|
| Pathogen MLP · B · mixed 50% | 3 | 0.941 | 0.059 | 0.953 | 0.890 |
| Pathogen MLP · C · mixed 50% | 3 | 0.945 | 0.051 | 0.959 | 0.889 |
| Joint MLP · C · mixed 50% | 3 | 0.983 | 0.071 | 0.988 | 0.964 |
| Joint MLP · B · mixed 50% | 3 | 0.991 | 0.054 | 0.997 | 0.966 |
| Target MLP · C · mixed 50% | 3 | 1.003 | 0.023 | 1.013 | 0.961 |
| Target convolution · C · mixed 50% | 3 | 1.010 | 0.085 | 1.026 | 0.944 |
| Target MLP · B · mixed 50% | 3 | 1.029 | 0.071 | 1.036 | 0.997 |
| Target convolution · B · mixed 50% | 3 | 1.032 | 0.030 | 1.045 | 0.982 |
| Target MLP · A · mixed 50% | 3 | 1.038 | 0.029 | 1.038 | 1.037 |
| Target convolution · A · mixed 50% | 3 | 1.070 | 0.042 | 1.079 | 1.032 |
| Joint MLP · A · mixed 50% | 3 | 1.086 | 0.241 | 1.086 | 1.086 |
| Pathogen MLP · A · mixed 50% | 3 | 1.126 | 0.138 | 1.118 | 1.157 |
| Joint MLP · Two-stage · mixed 50% | 3 | 1.194 | 0.097 | 1.178 | 1.256 |
| Target MLP · Two-stage · mixed 50% | 3 | 1.203 | 0.056 | 1.198 | 1.225 |
| Target convolution · Two-stage · mixed 50% | 3 | 1.215 | 0.043 | 1.218 | 1.203 |
| Pathogen MLP · Two-stage · mixed 50% | 3 | 1.292 | 0.272 | 1.293 | 1.292 |
Ranking CSV · Per-seed scores.
What changed from the first screen
Every row below uses the same architecture, formulation, masking, and completed seed on both sides. Input hashes and scored target/season/location/horizon support match. The target MLP, pathogen MLP, and target convolution change cap 100 → 300. Joint MLP was already capped at 300: its rows are repeat controls. Negative changes favor the follow-up; seed SD is descriptive, not a confidence interval.
| Configuration | Paired seeds | Original screen | Cap 300 | Δ WIS | Seed Δ SD | Seeds improved |
|---|---|---|---|---|---|---|
| Target MLP · A · mixed 50% | 3 | 1.029 | 1.038 | 0.009 | 0.006 | 0 |
| Target MLP · B · mixed 50% | 3 | 0.980 | 1.029 | 0.048 | 0.033 | 0 |
| Target MLP · C · mixed 50% | 3 | 0.985 | 1.003 | 0.018 | 0.013 | 0 |
| Target MLP · Two-stage · mixed 50% | 3 | 1.179 | 1.203 | 0.024 | 0.050 | 1 |
| Pathogen MLP · A · mixed 50% | 3 | 1.045 | 1.126 | 0.081 | 0.144 | 1 |
| Pathogen MLP · B · mixed 50% | 3 | 0.952 | 0.941 | -0.011 | 0.011 | 3 |
| Pathogen MLP · C · mixed 50% | 3 | 0.957 | 0.945 | -0.011 | 0.019 | 2 |
| Pathogen MLP · Two-stage · mixed 50% | 3 | 1.104 | 1.292 | 0.189 | 0.291 | 1 |
| Target convolution · A · mixed 50% | 3 | 1.100 | 1.070 | -0.030 | 0.052 | 2 |
| Target convolution · B · mixed 50% | 3 | 1.031 | 1.032 | 0.001 | 0.012 | 2 |
| Target convolution · C · mixed 50% | 3 | 1.005 | 1.010 | 0.005 | 0.007 | 1 |
| Target convolution · Two-stage · mixed 50% | 3 | 1.206 | 1.215 | 0.009 | 0.029 | 2 |
| Joint MLP · A · mixed 50% | 3 | 1.012 | 1.086 | 0.074 | 0.126 | 1 |
| Joint MLP · B · mixed 50% | 3 | 0.990 | 0.991 | 0.000 | 0.000 | 0 |
| Joint MLP · C · mixed 50% | 3 | 0.972 | 0.983 | 0.011 | 0.020 | 1 |
| Joint MLP · Two-stage · mixed 50% | 3 | 1.211 | 1.194 | -0.017 | 0.027 | 2 |
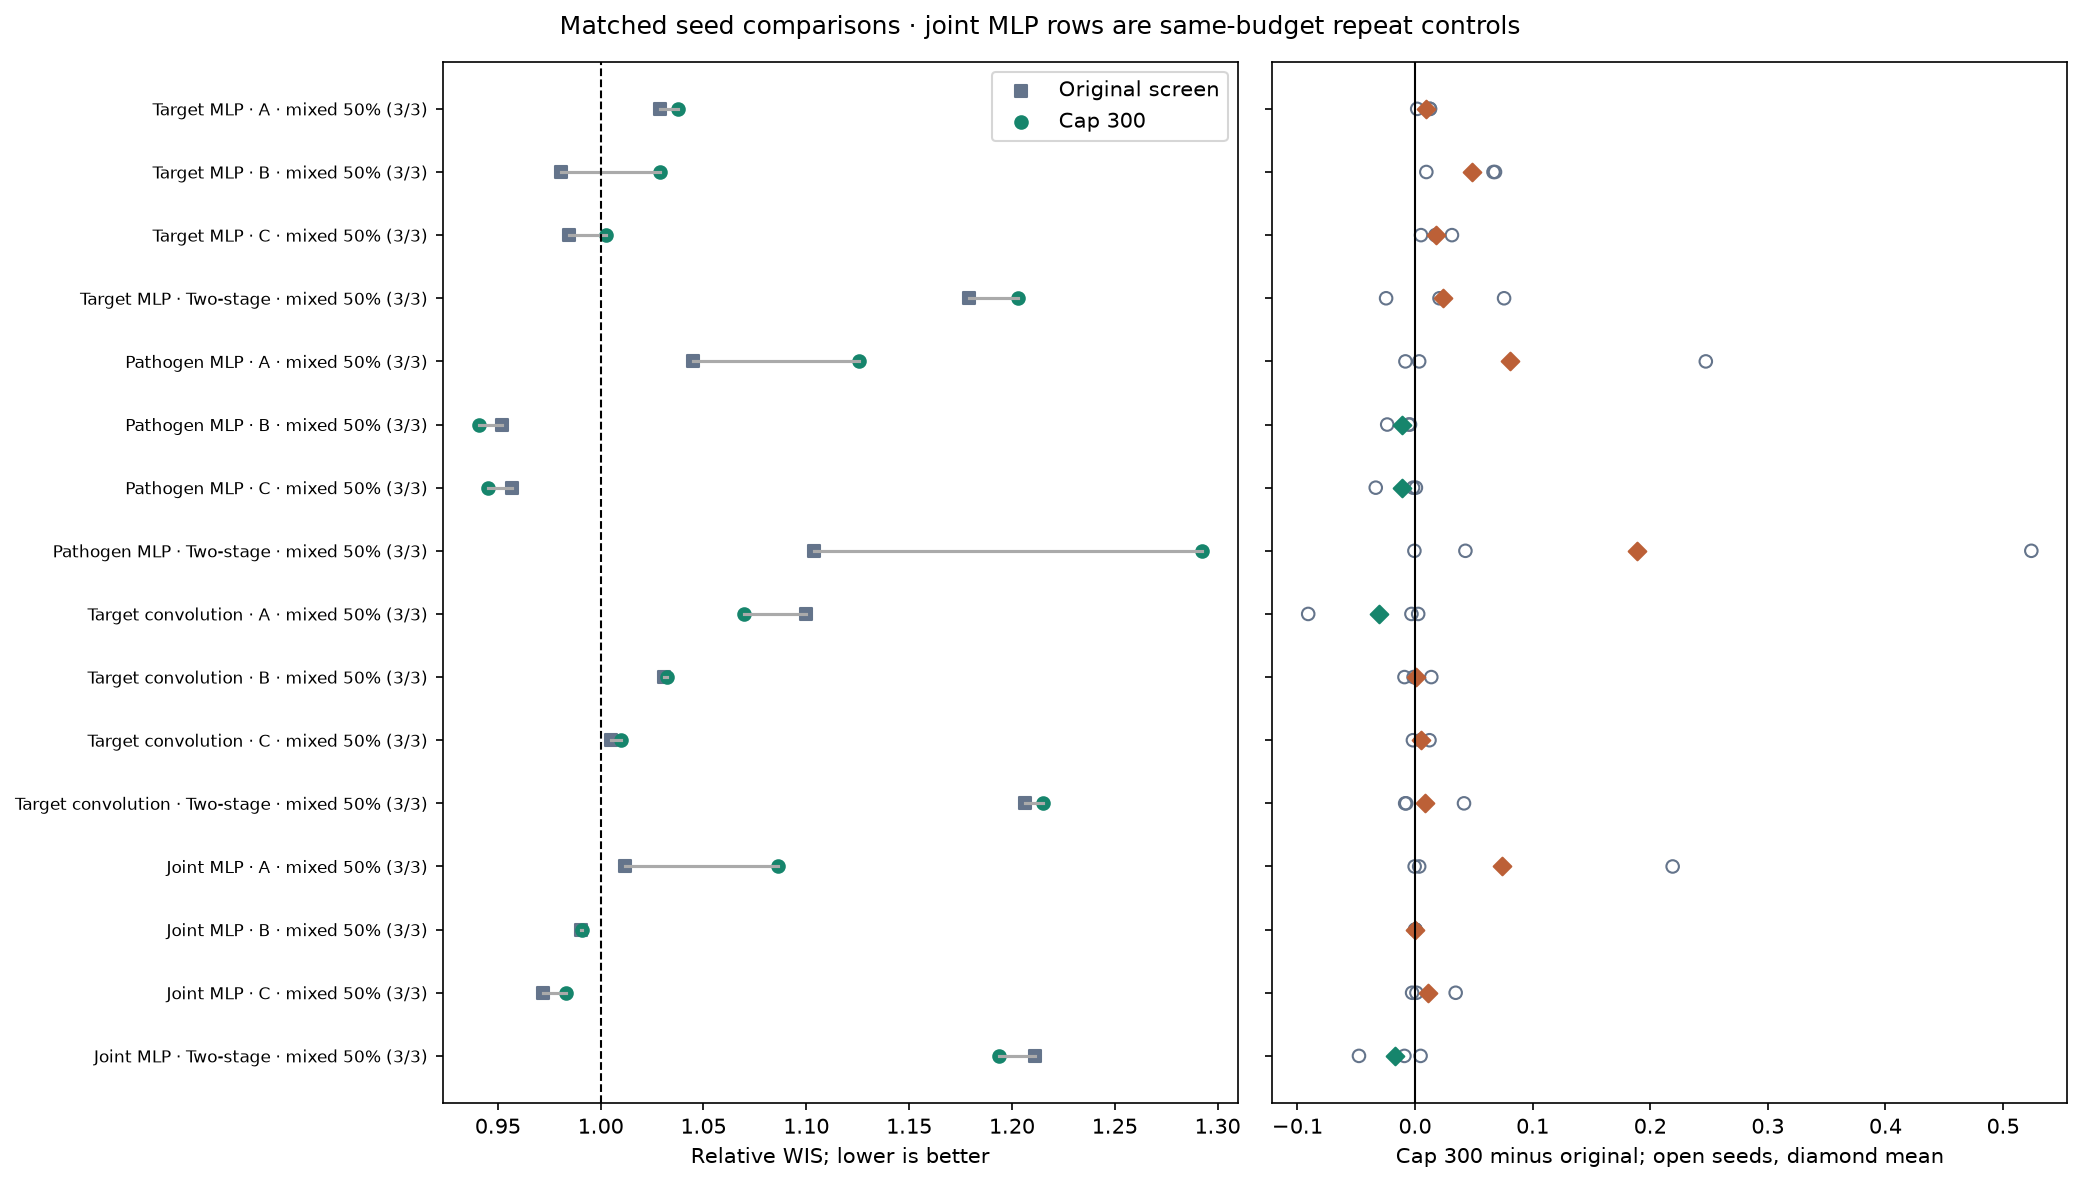
Pathogen B and C remain the strongest candidates in this follow-up. B changes from 0.952 to 0.941, improving in 3/3 seeds; C changes from 0.957 to 0.945, improving in 2/3. Their small gap does not establish a reliable preference between flags alone and auxiliary nowcasting.
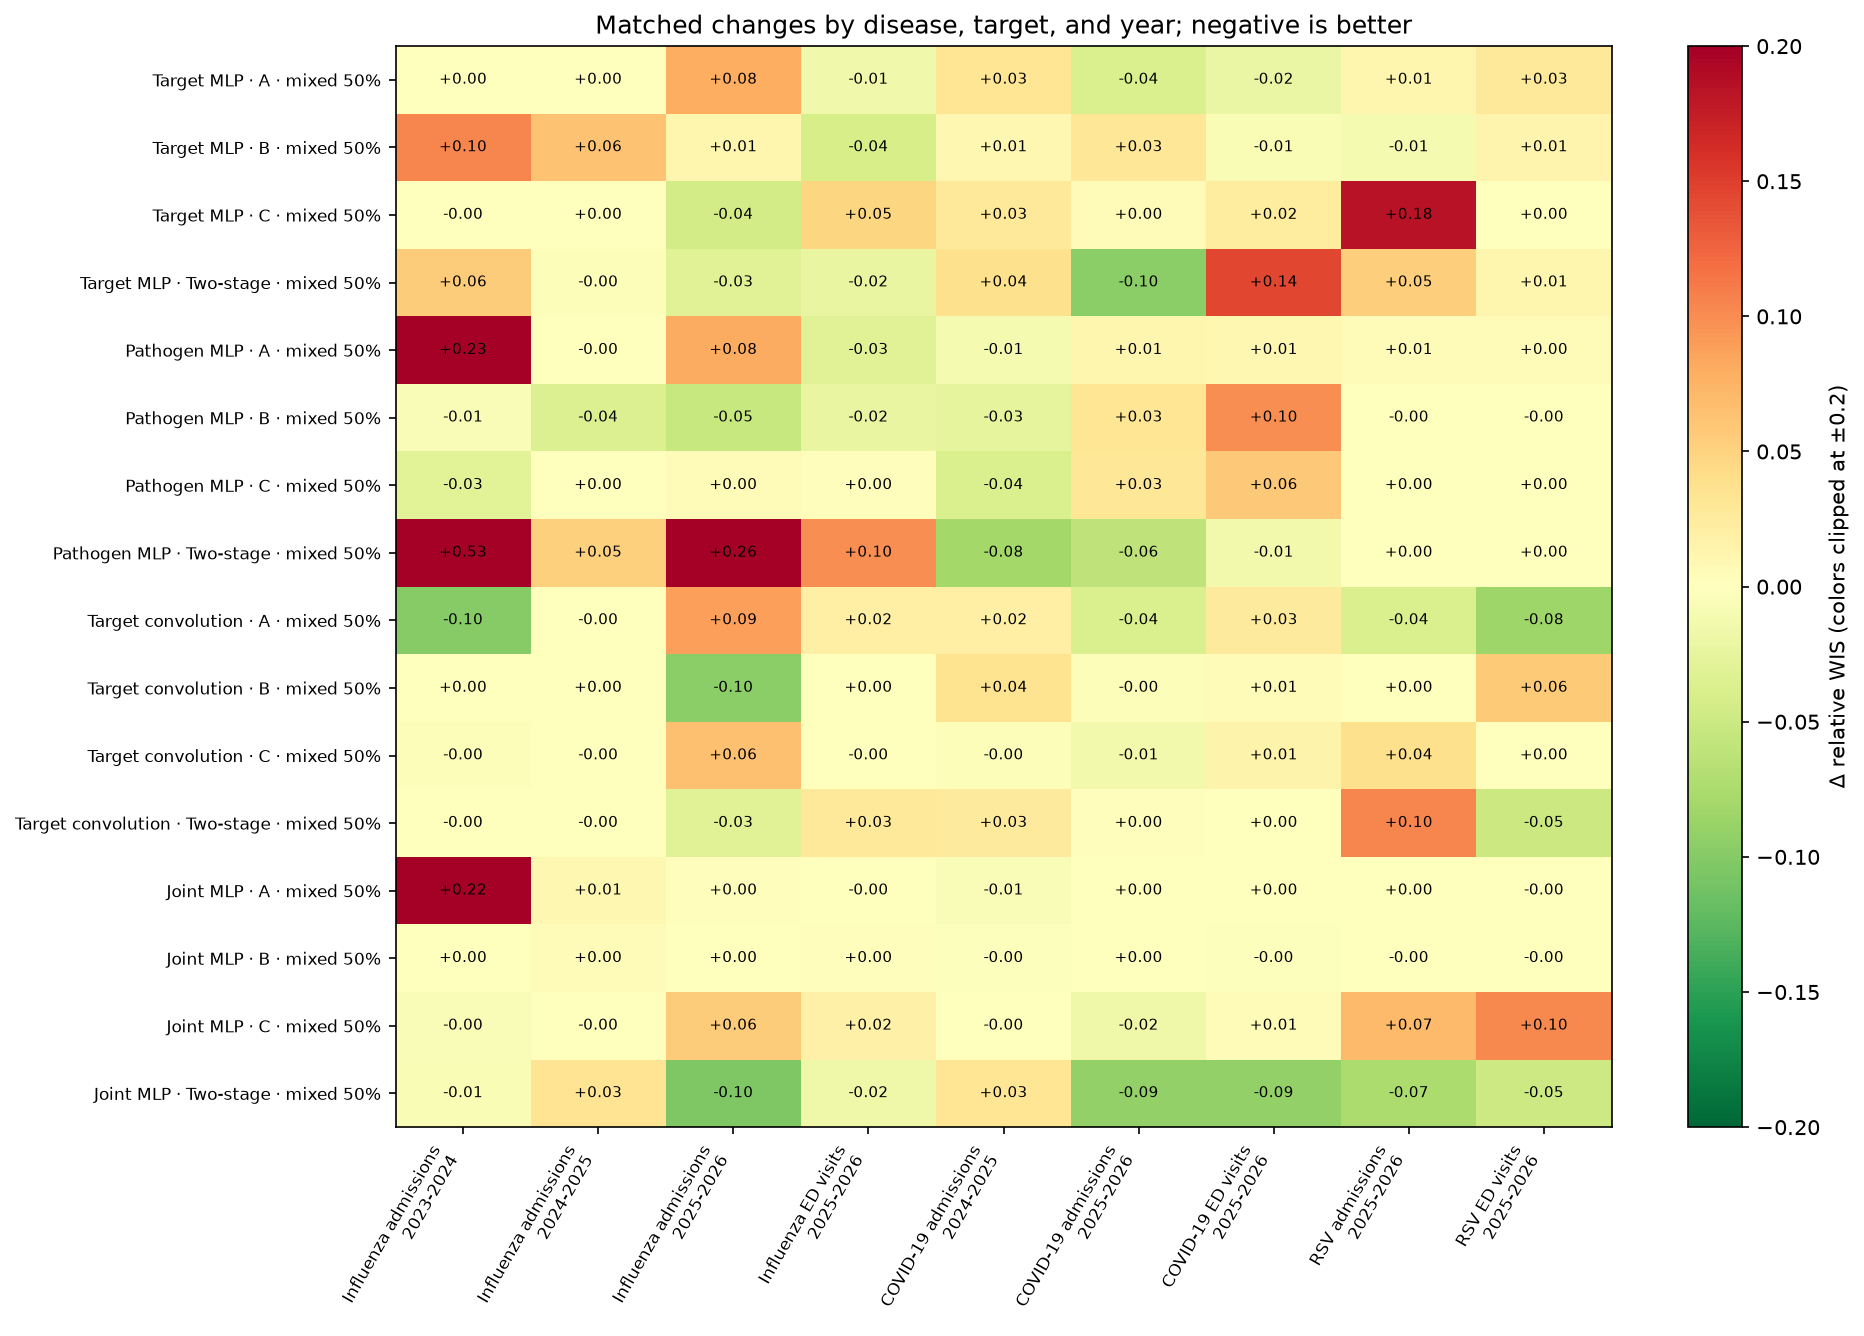
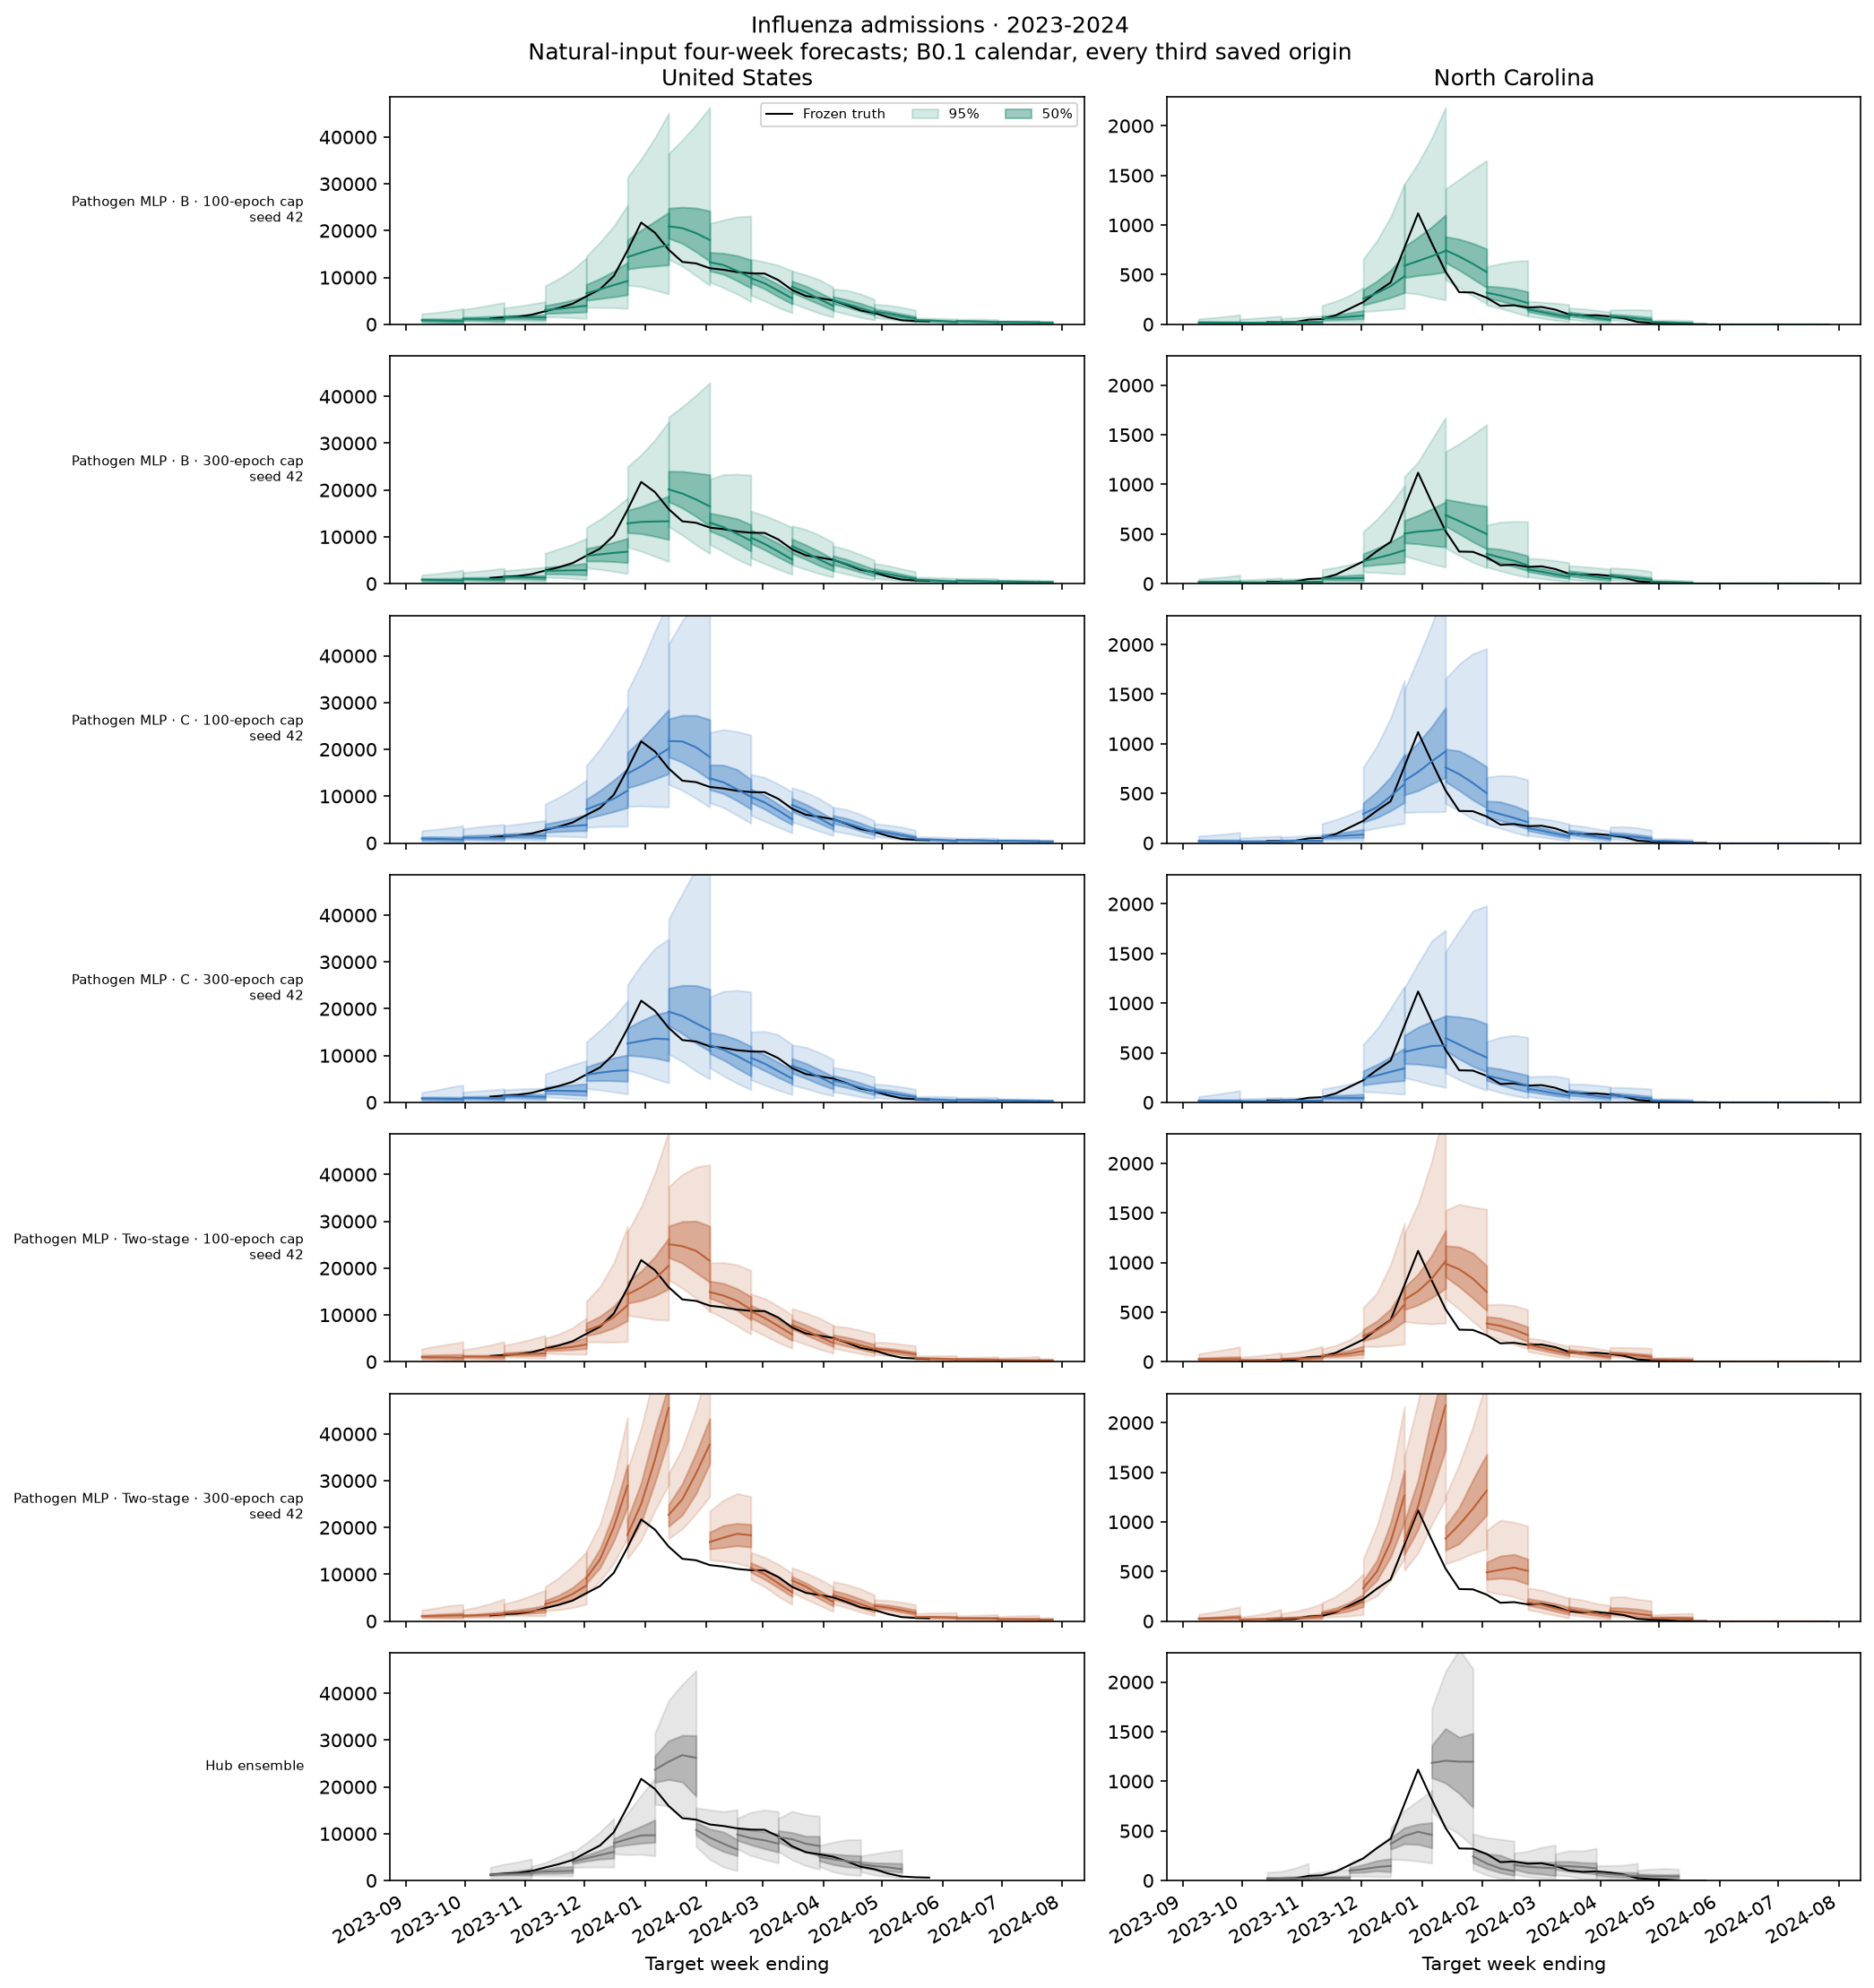
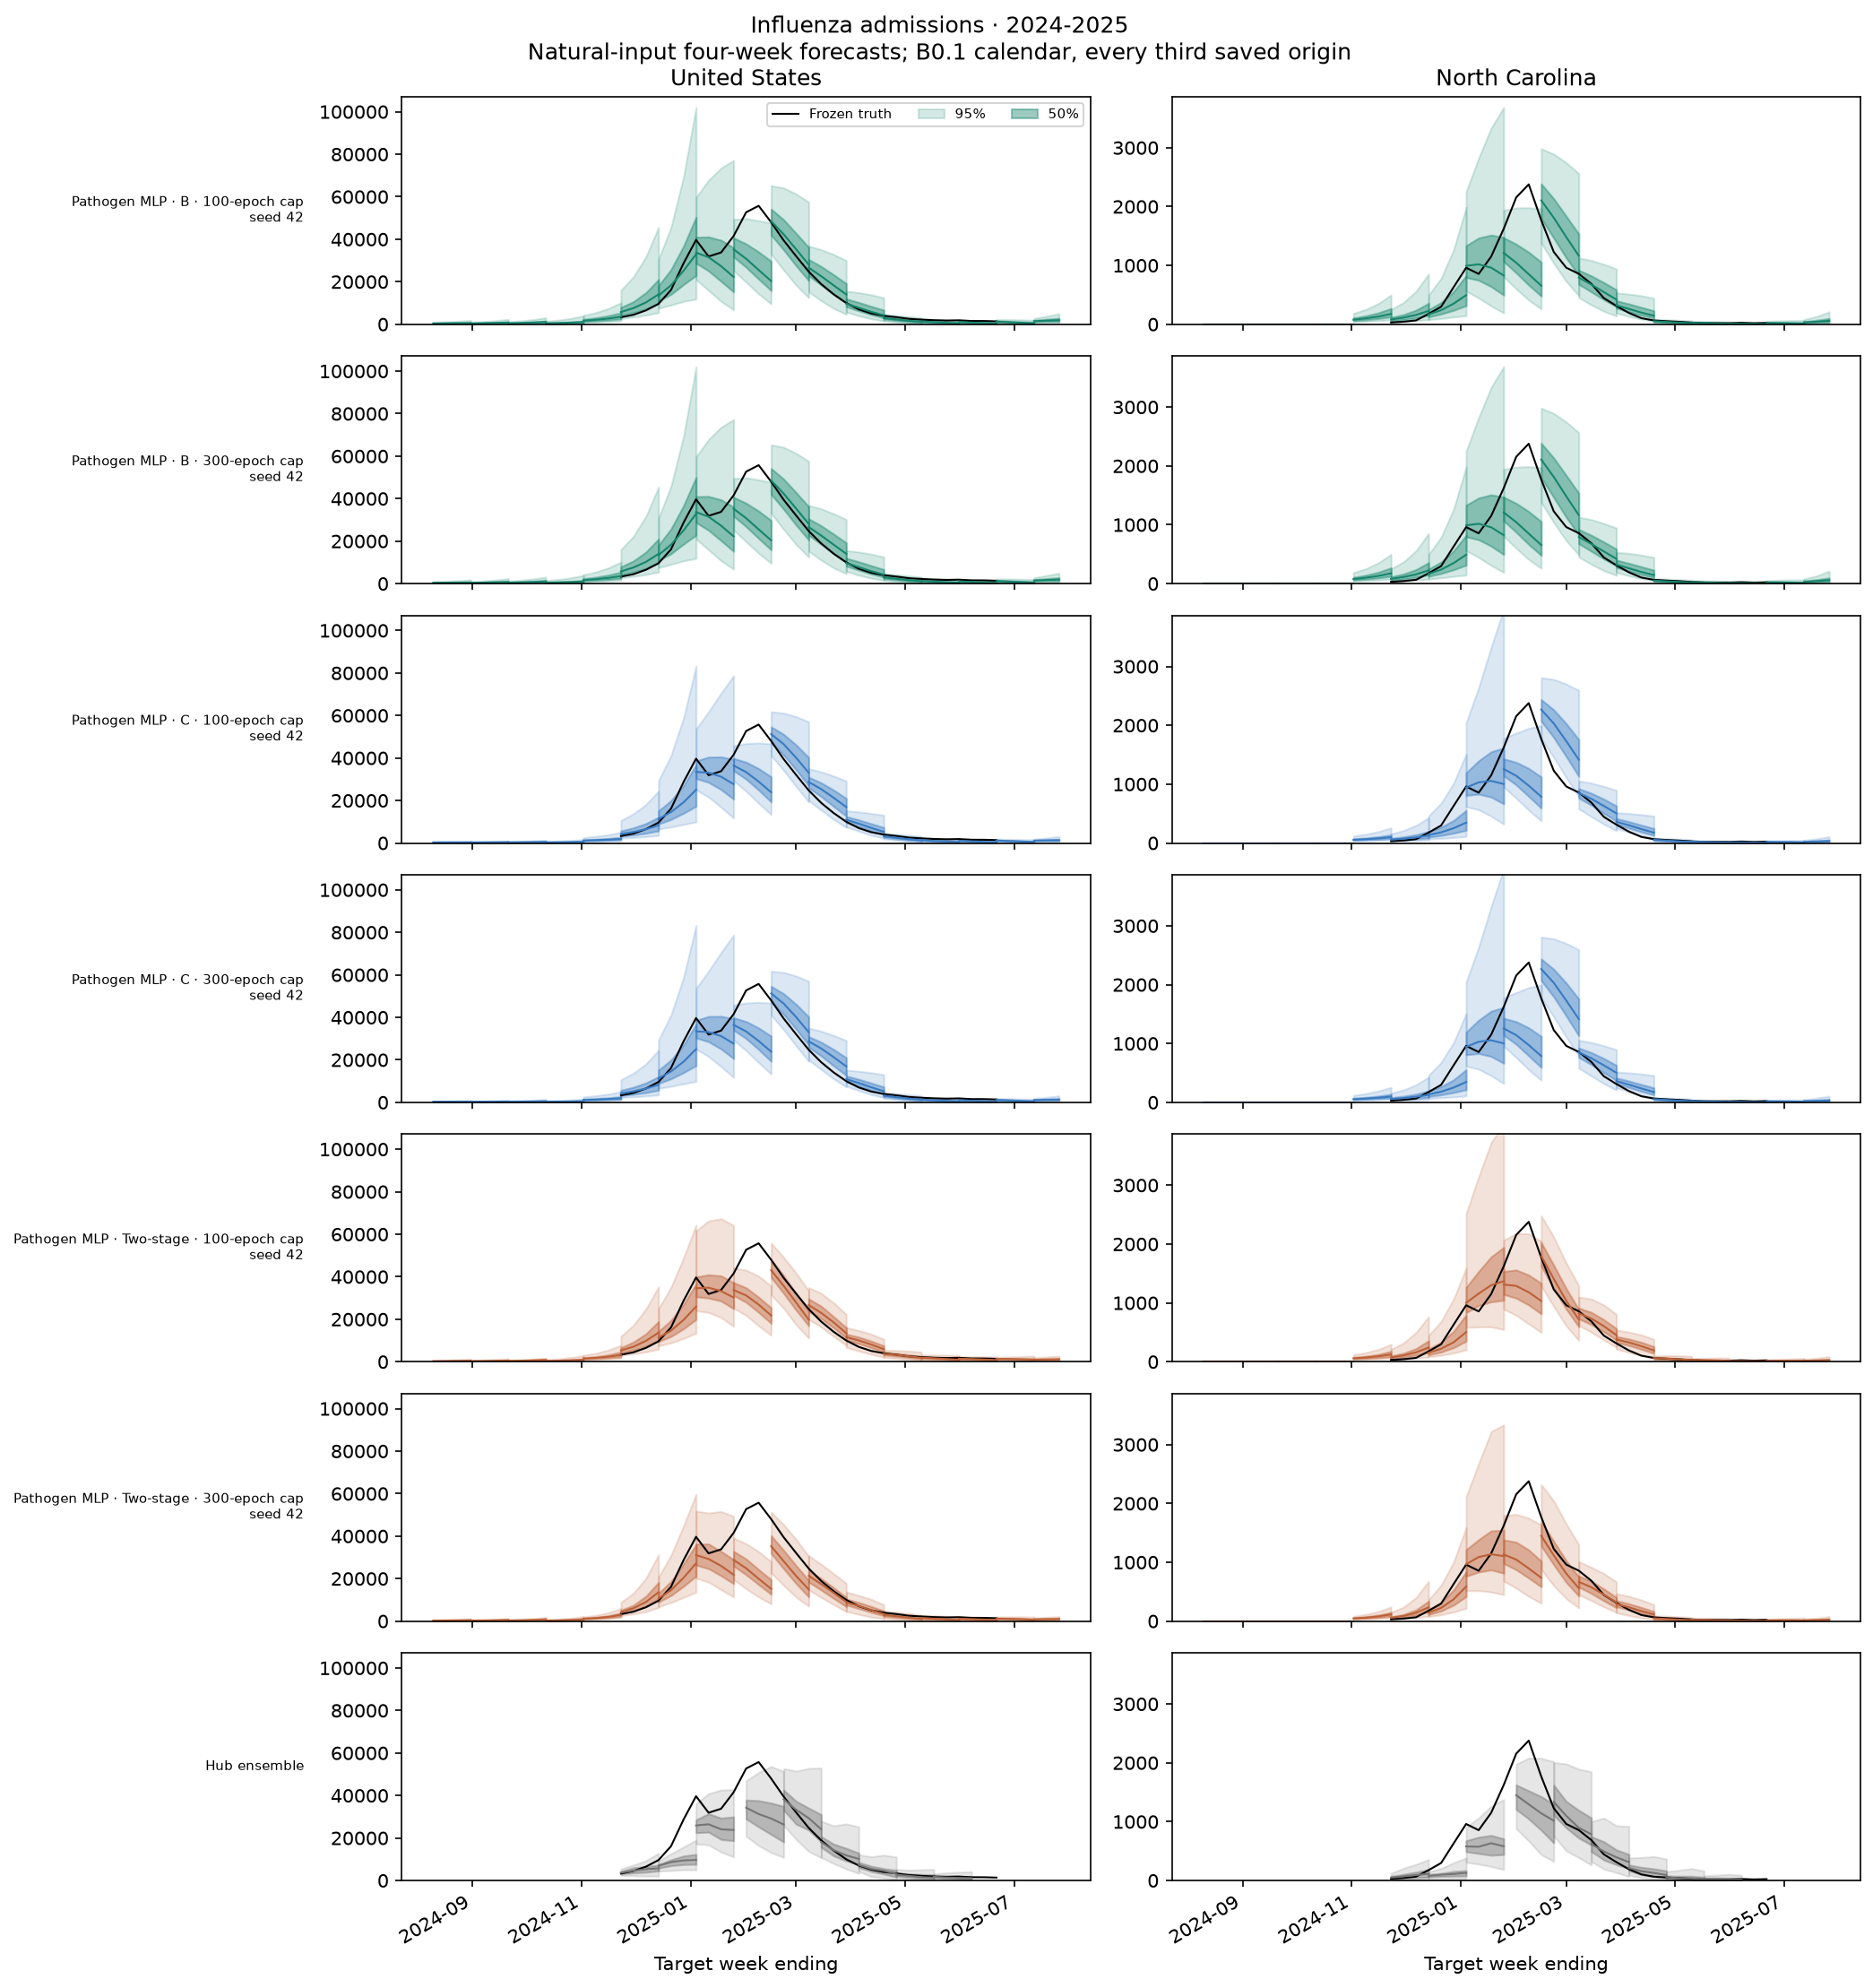
Longer training does not rescue the current two-stage formulation. Its follow-up configuration means remain above ensemble parity in every architecture. Pathogen two-stage changes from 1.104 to 1.292; the paired seed table shows a large deterioration for seed 42. This weakens the explanation that the initial poor results were simply due to the 100-epoch cap. It does not identify which part of the formulation fails.
More training is not a universal gain. Use the paired rows, not the best score from each differently sized suite, to judge a recipe. Target B changes from 0.980 to 1.029, and target C from 0.985 to 1.003; neither improves in any of the three matched seeds. The original gap-only leader is not included in this budget contrast. Repeat variability also matters: joint-direct seed 44 changes from 1.144 to 1.363 despite retaining cap 300. The cause is not established here; the saved fitting code is unchanged between source snapshots, whose changes add suite routing.
Calibration remains a limitation. The cap-300 leader's weighted 50% and 95% coverage are 43.3% and 84.6%. These use the same geography/target/season weights as the ranking.
Where performance changes
Disease → target → chronological season, matching the fan order. Values are paired seed-mean changes, not changes between averages with different seeds. Joint rows remain repeat controls. Color saturation does not truncate the printed values.
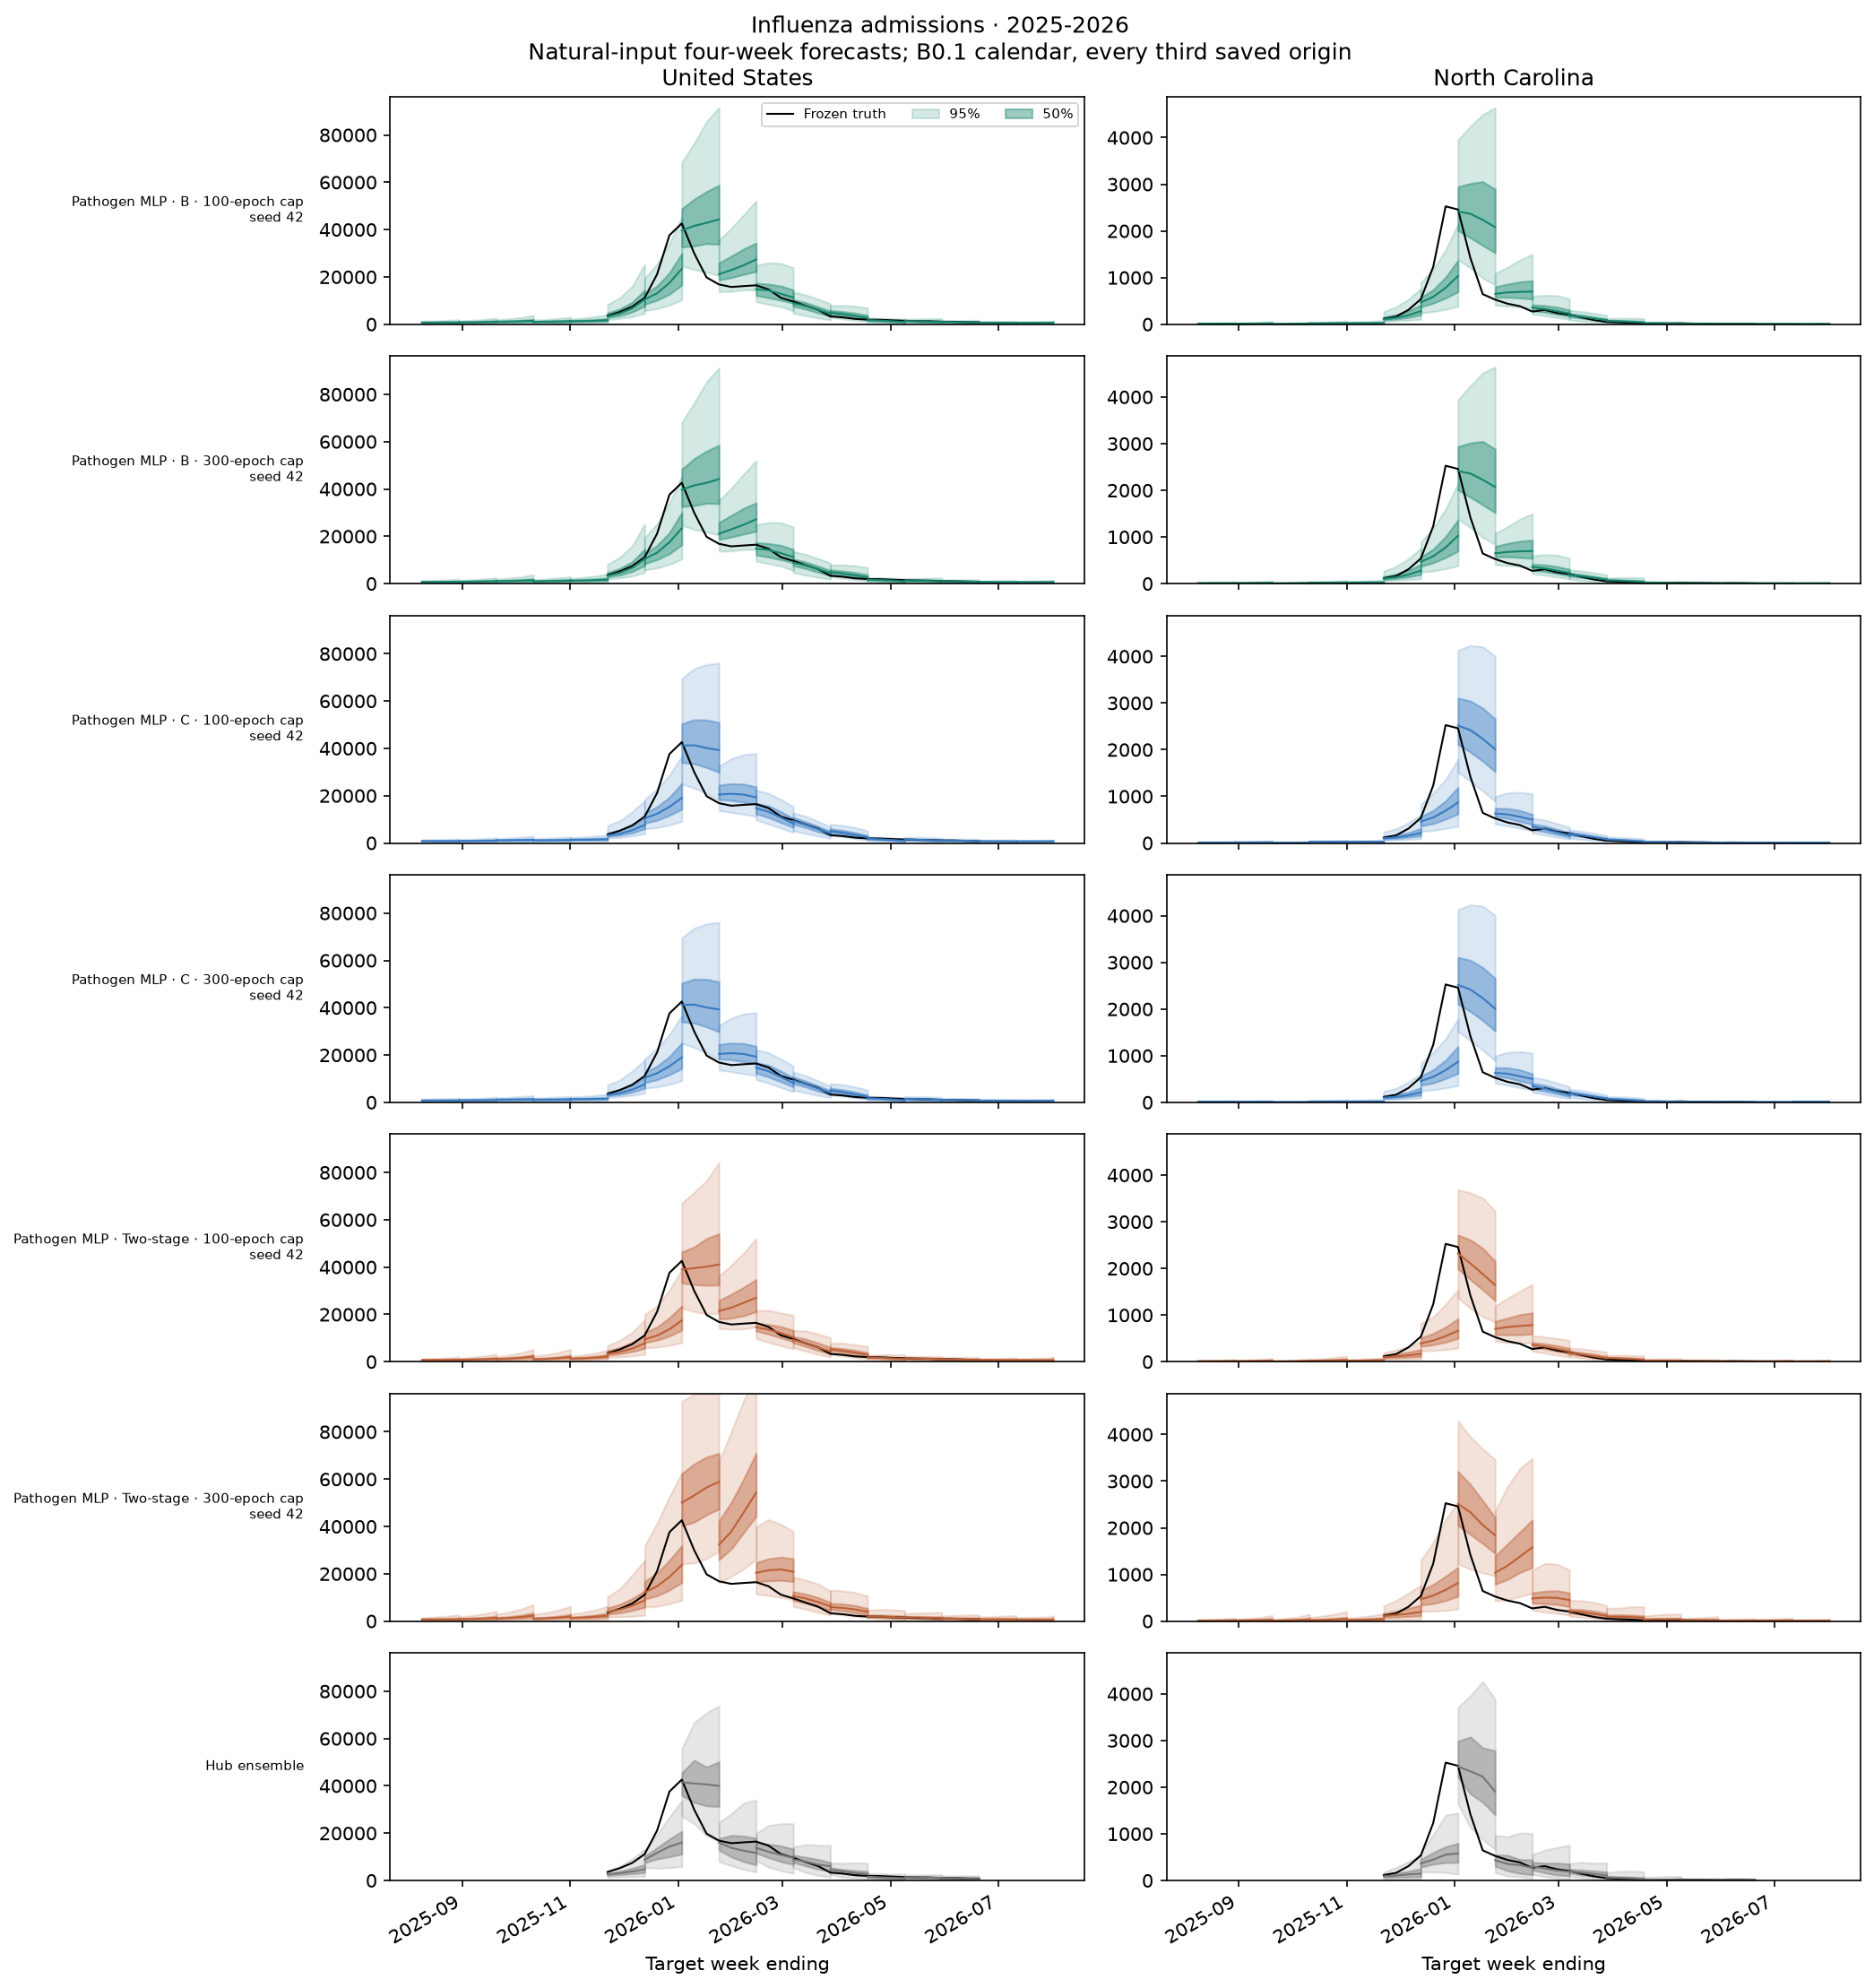
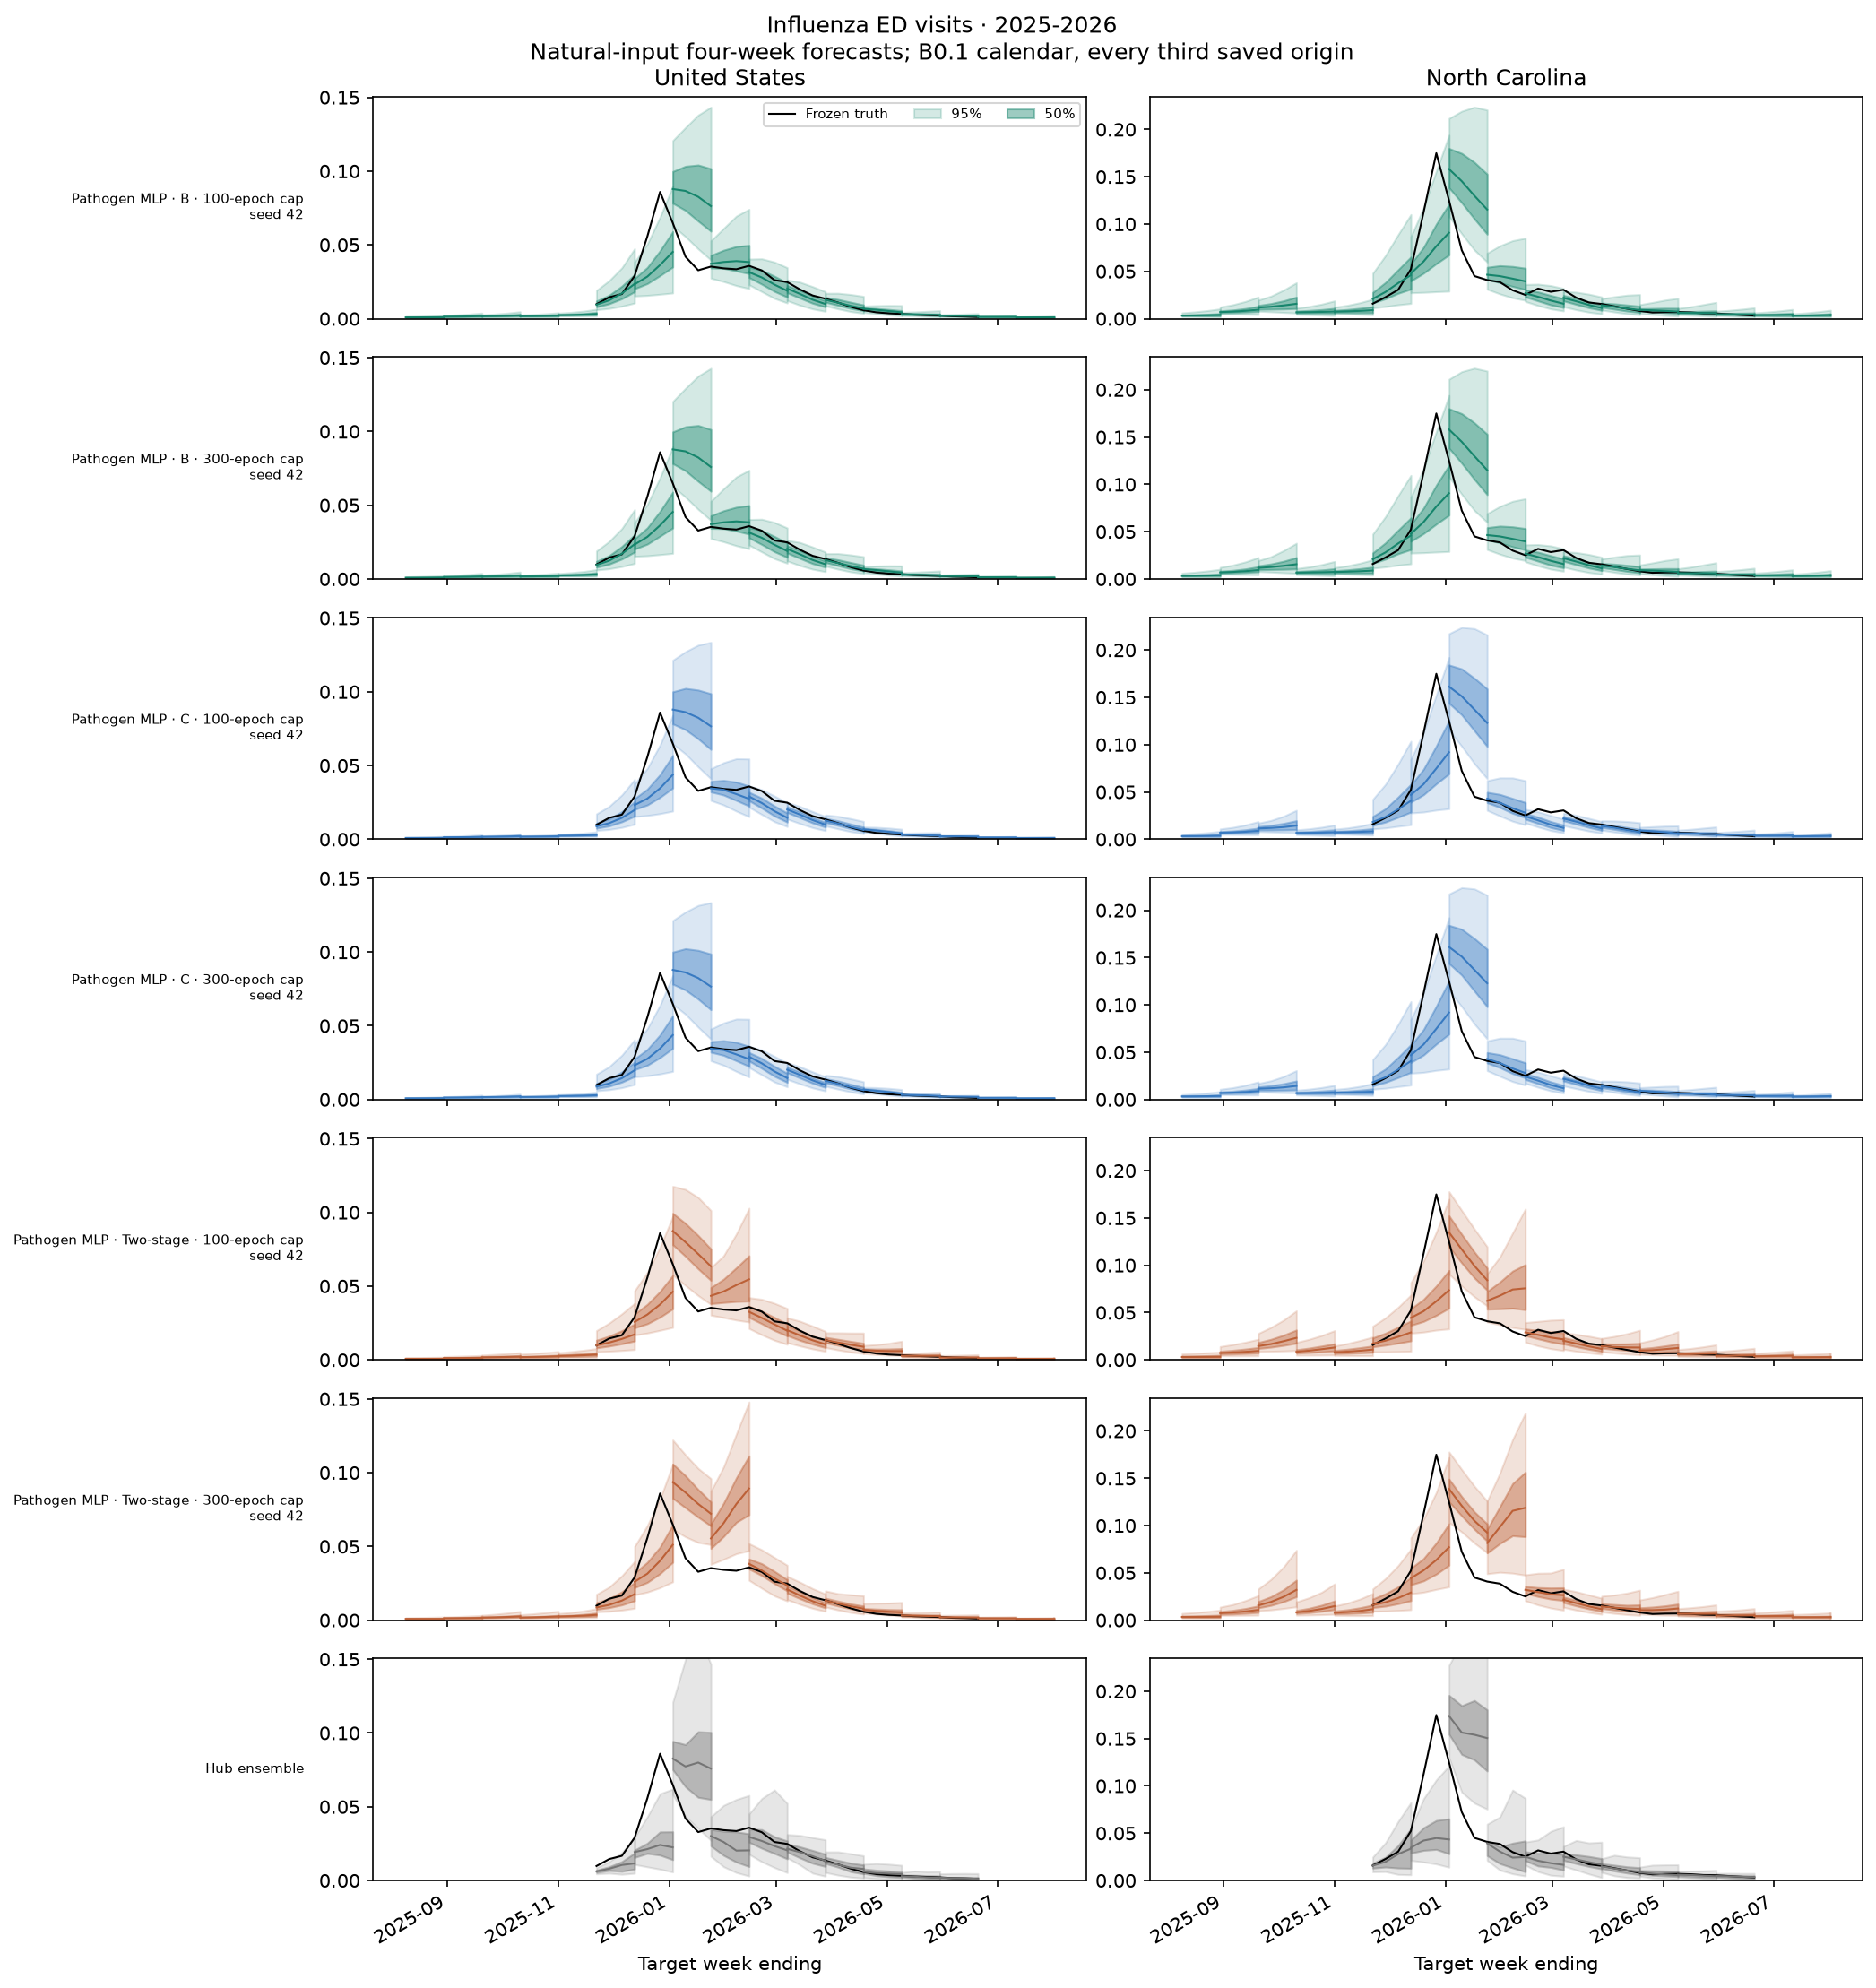
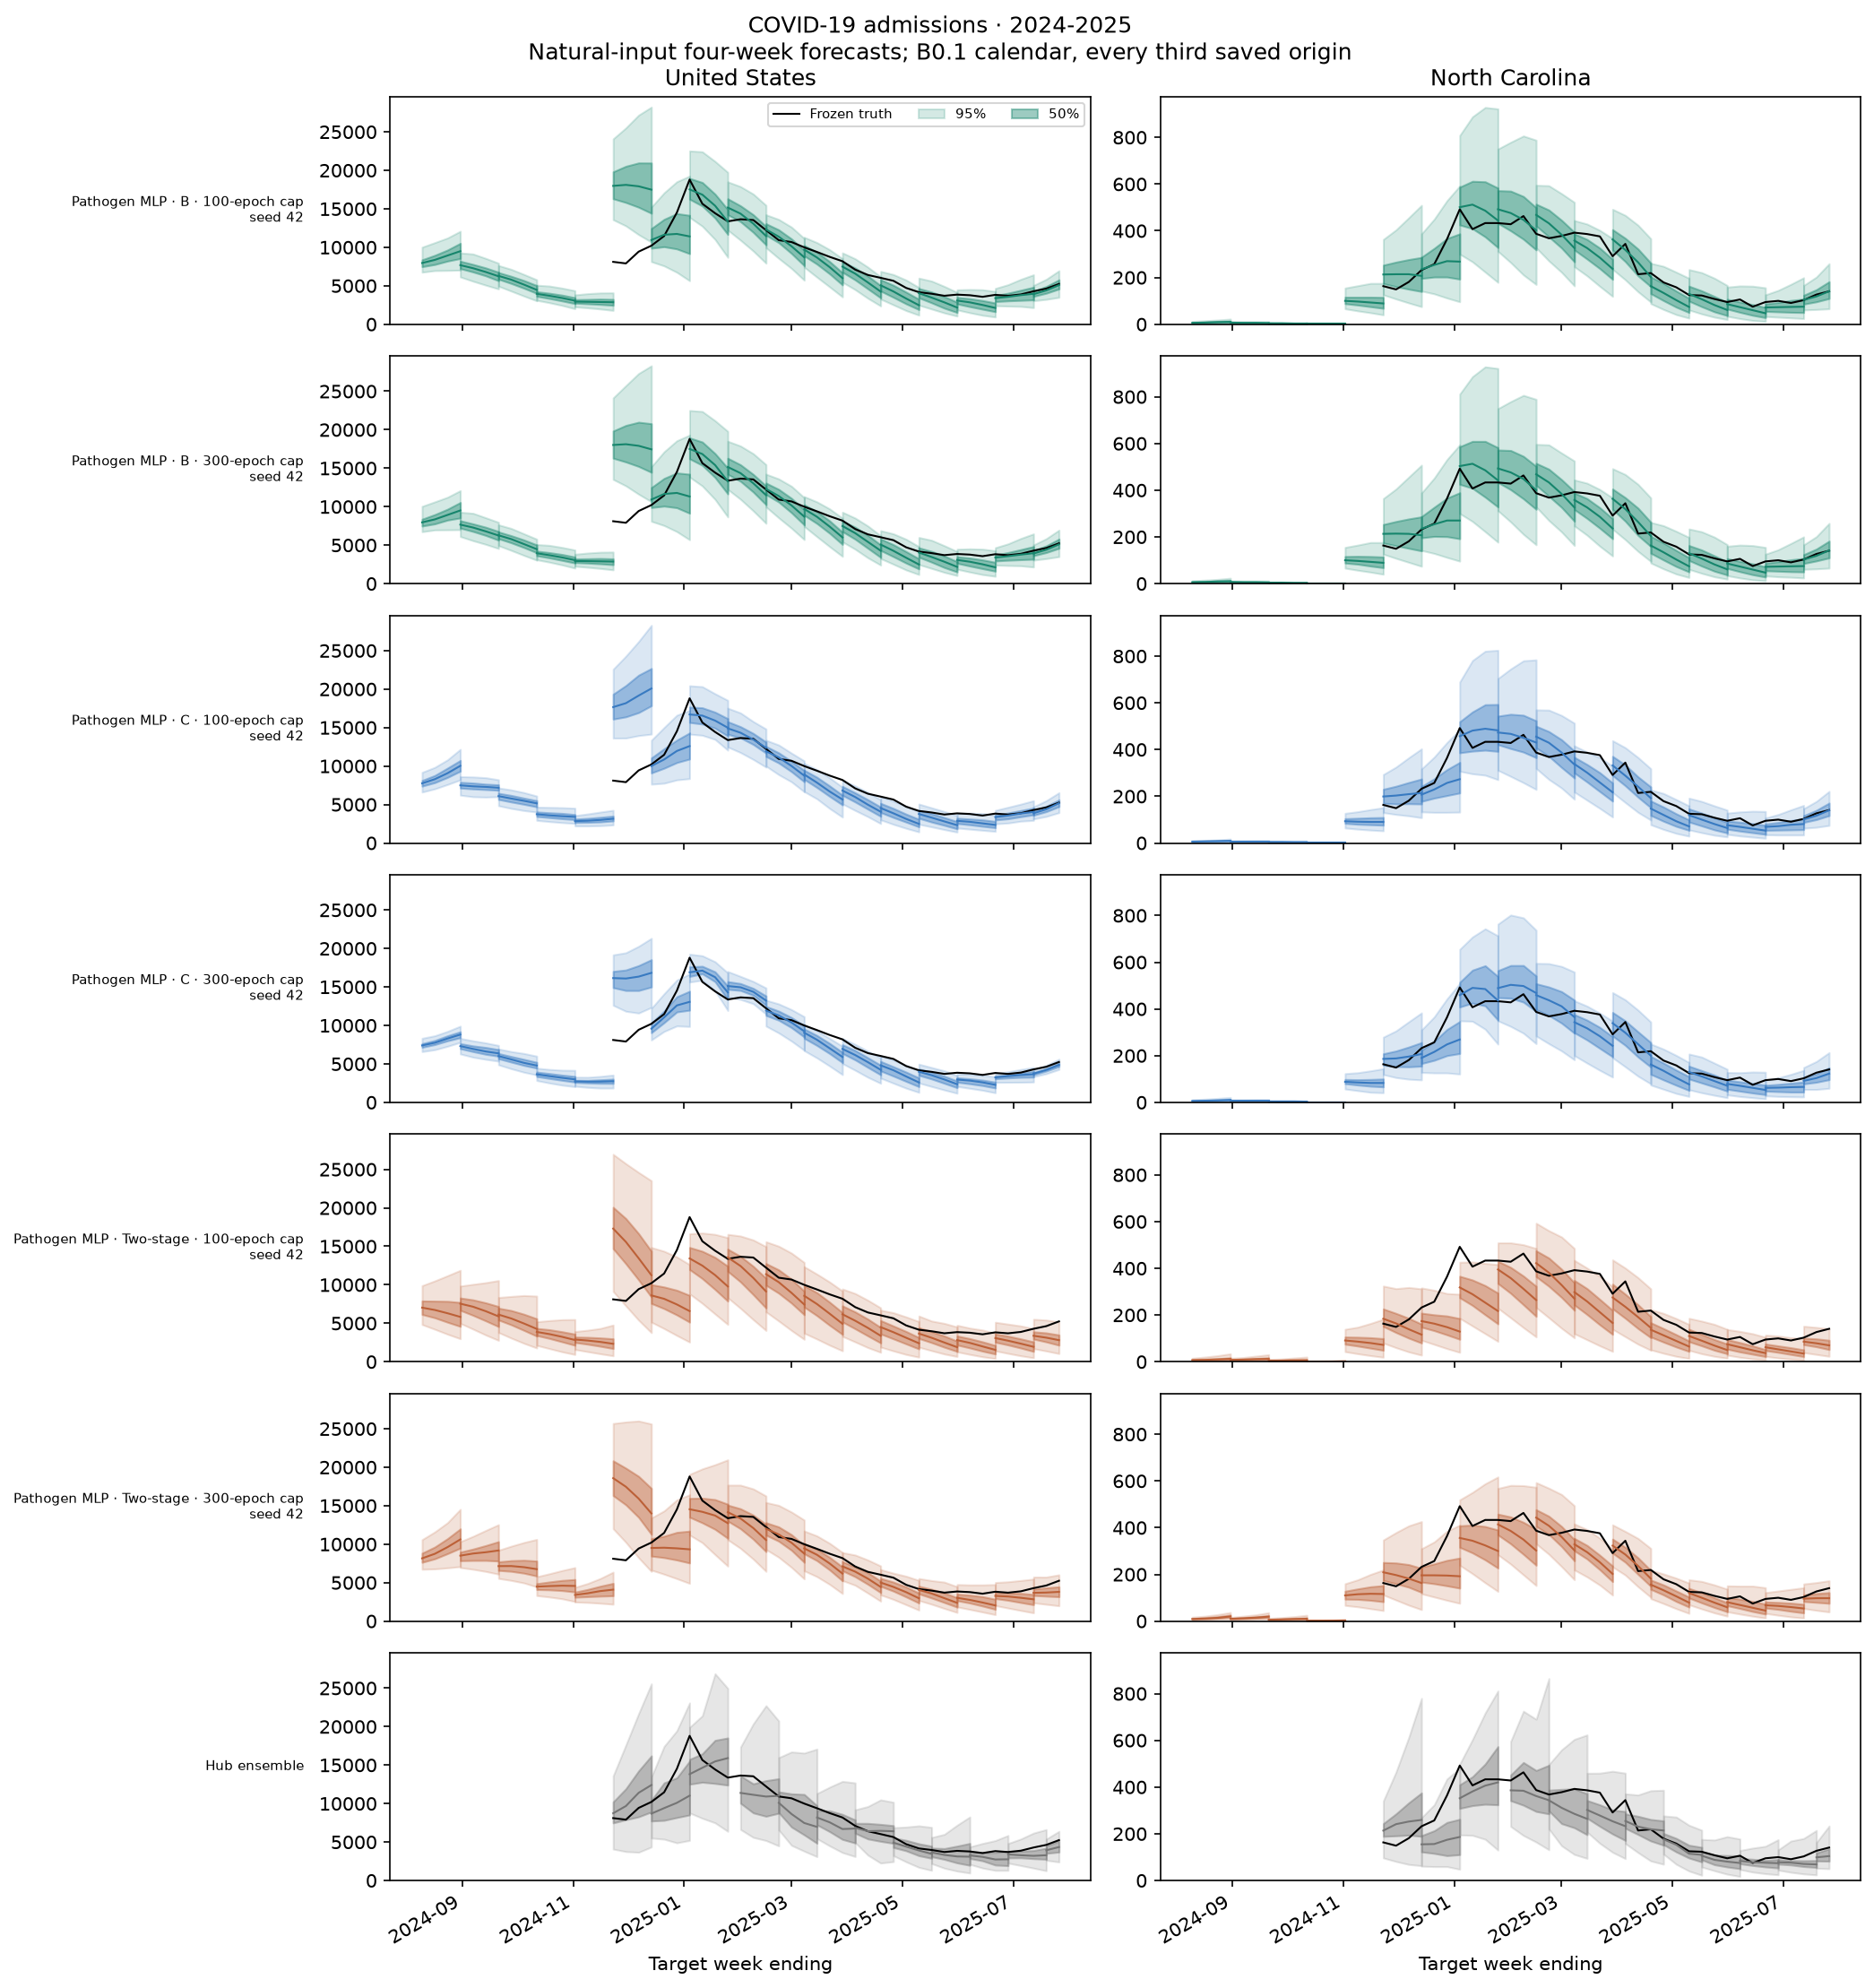
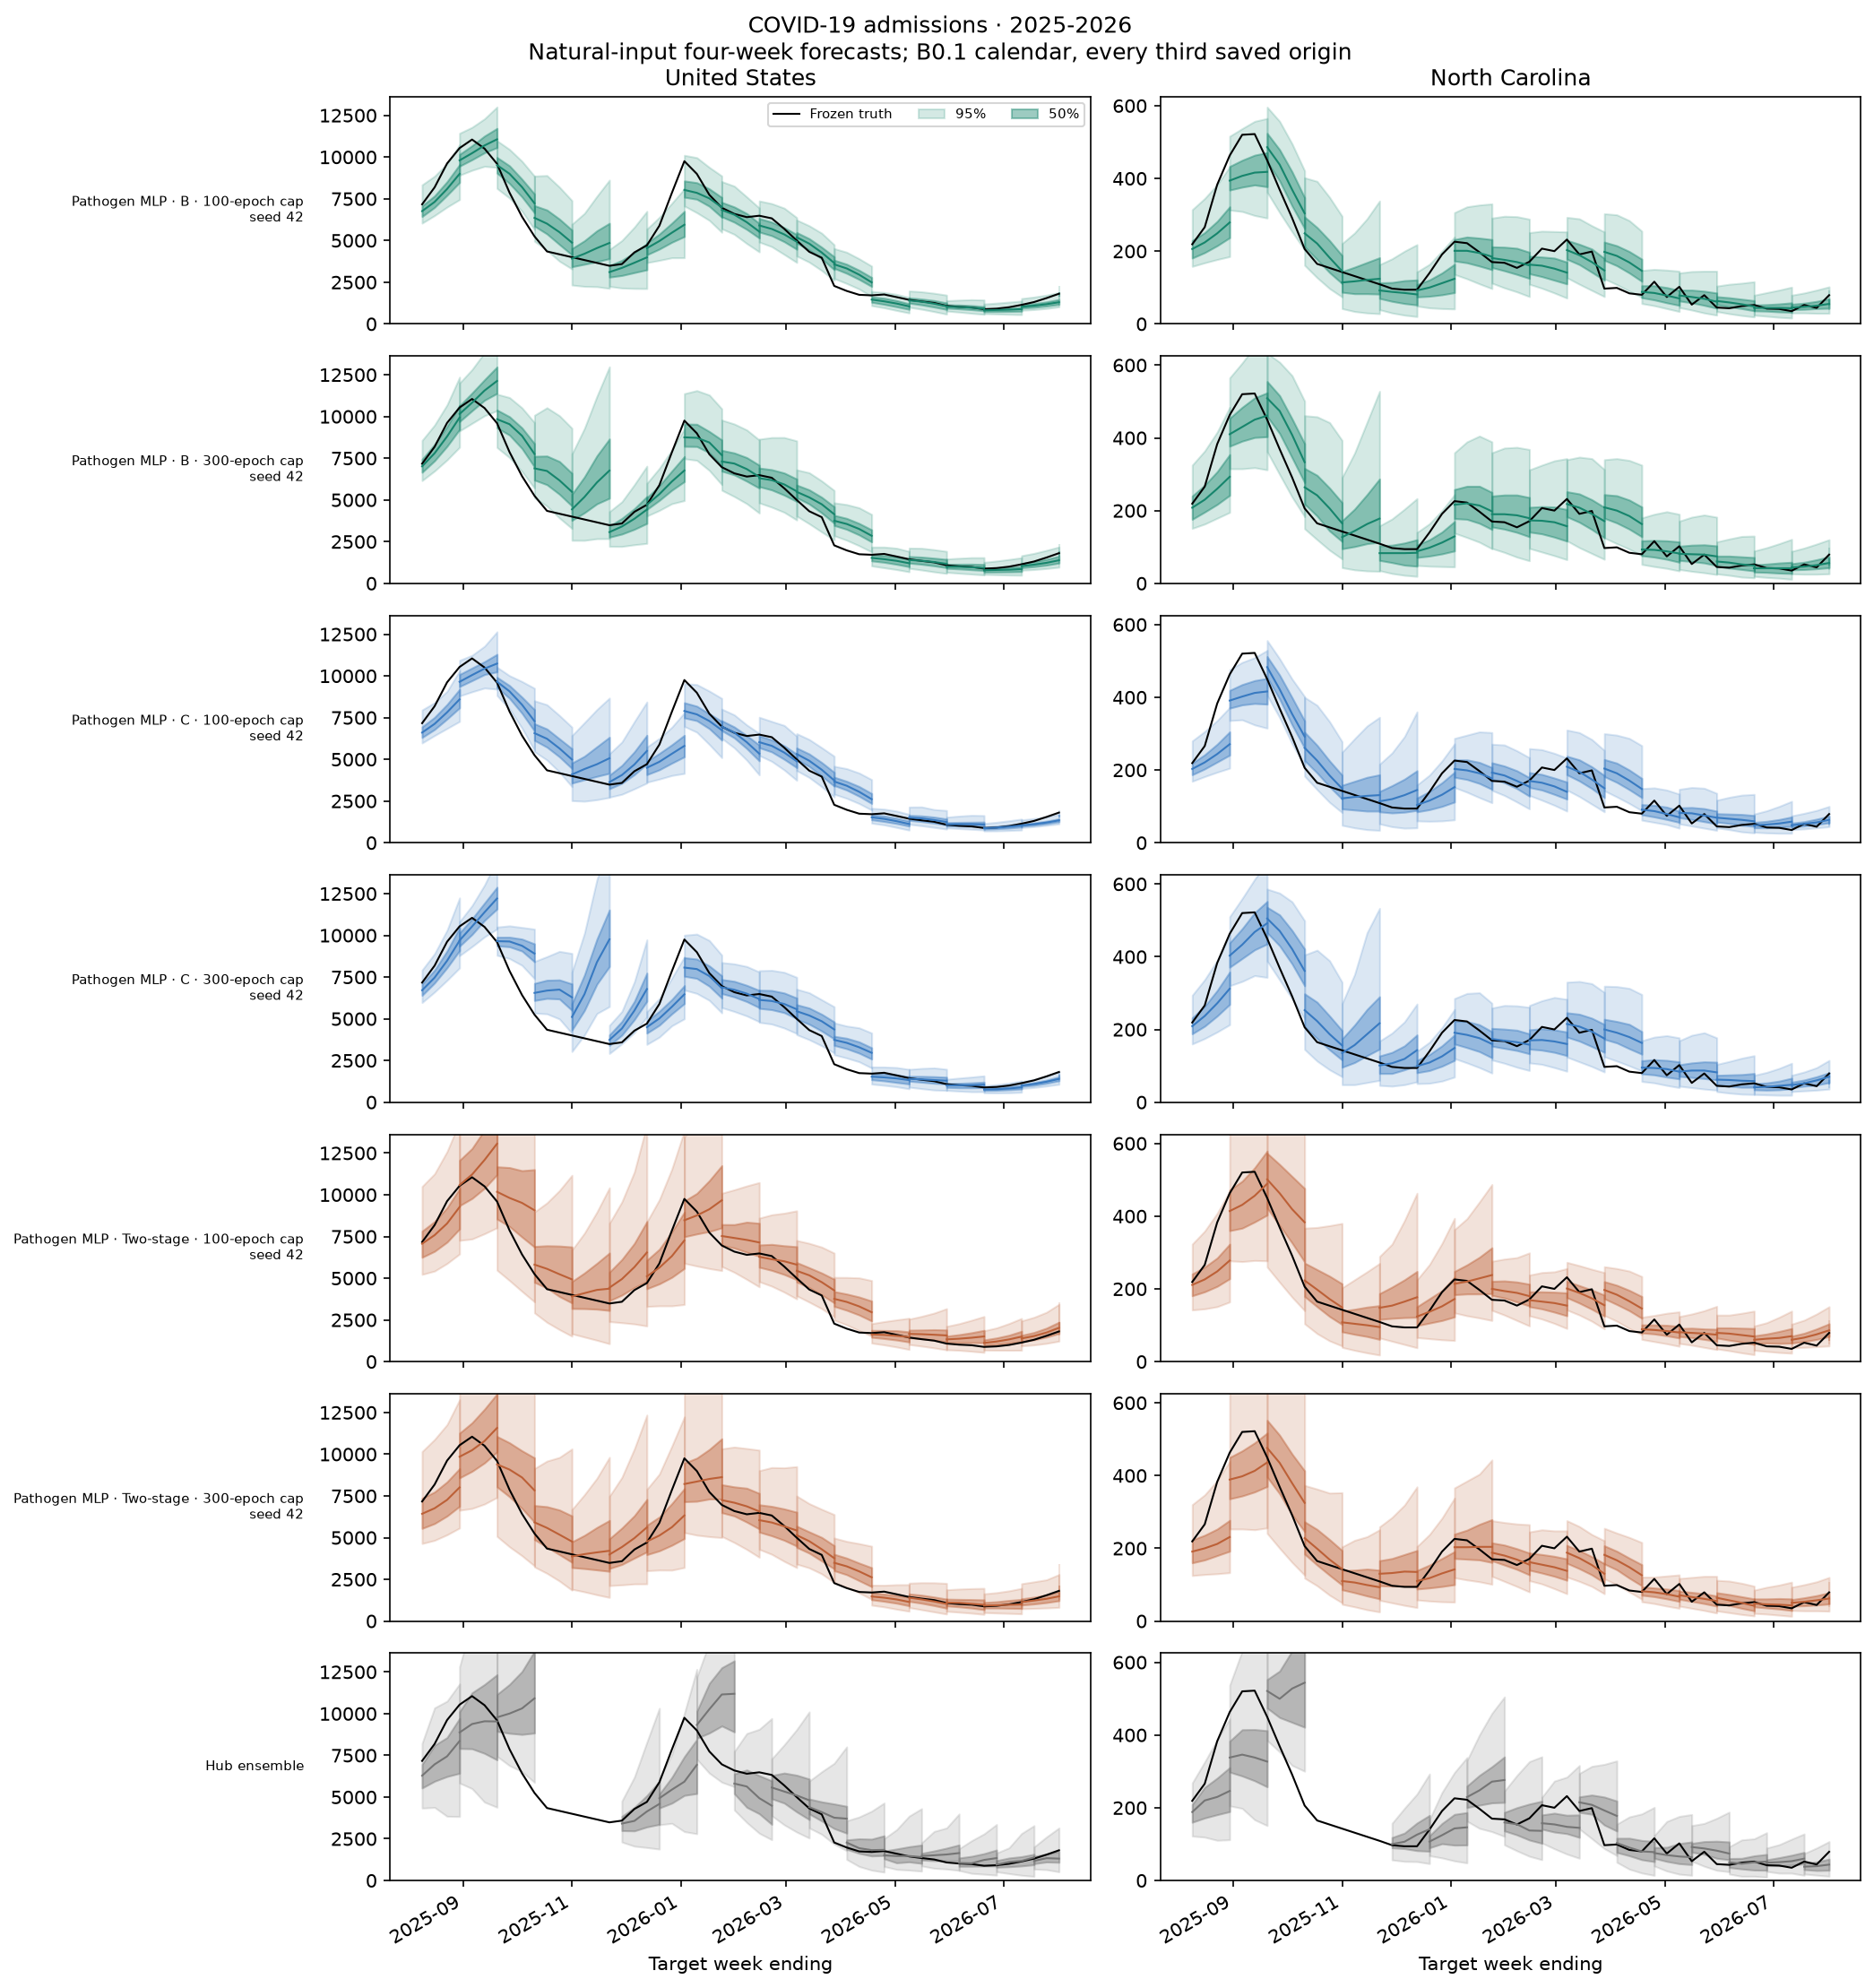
Matched 100-vs-300 fan plots
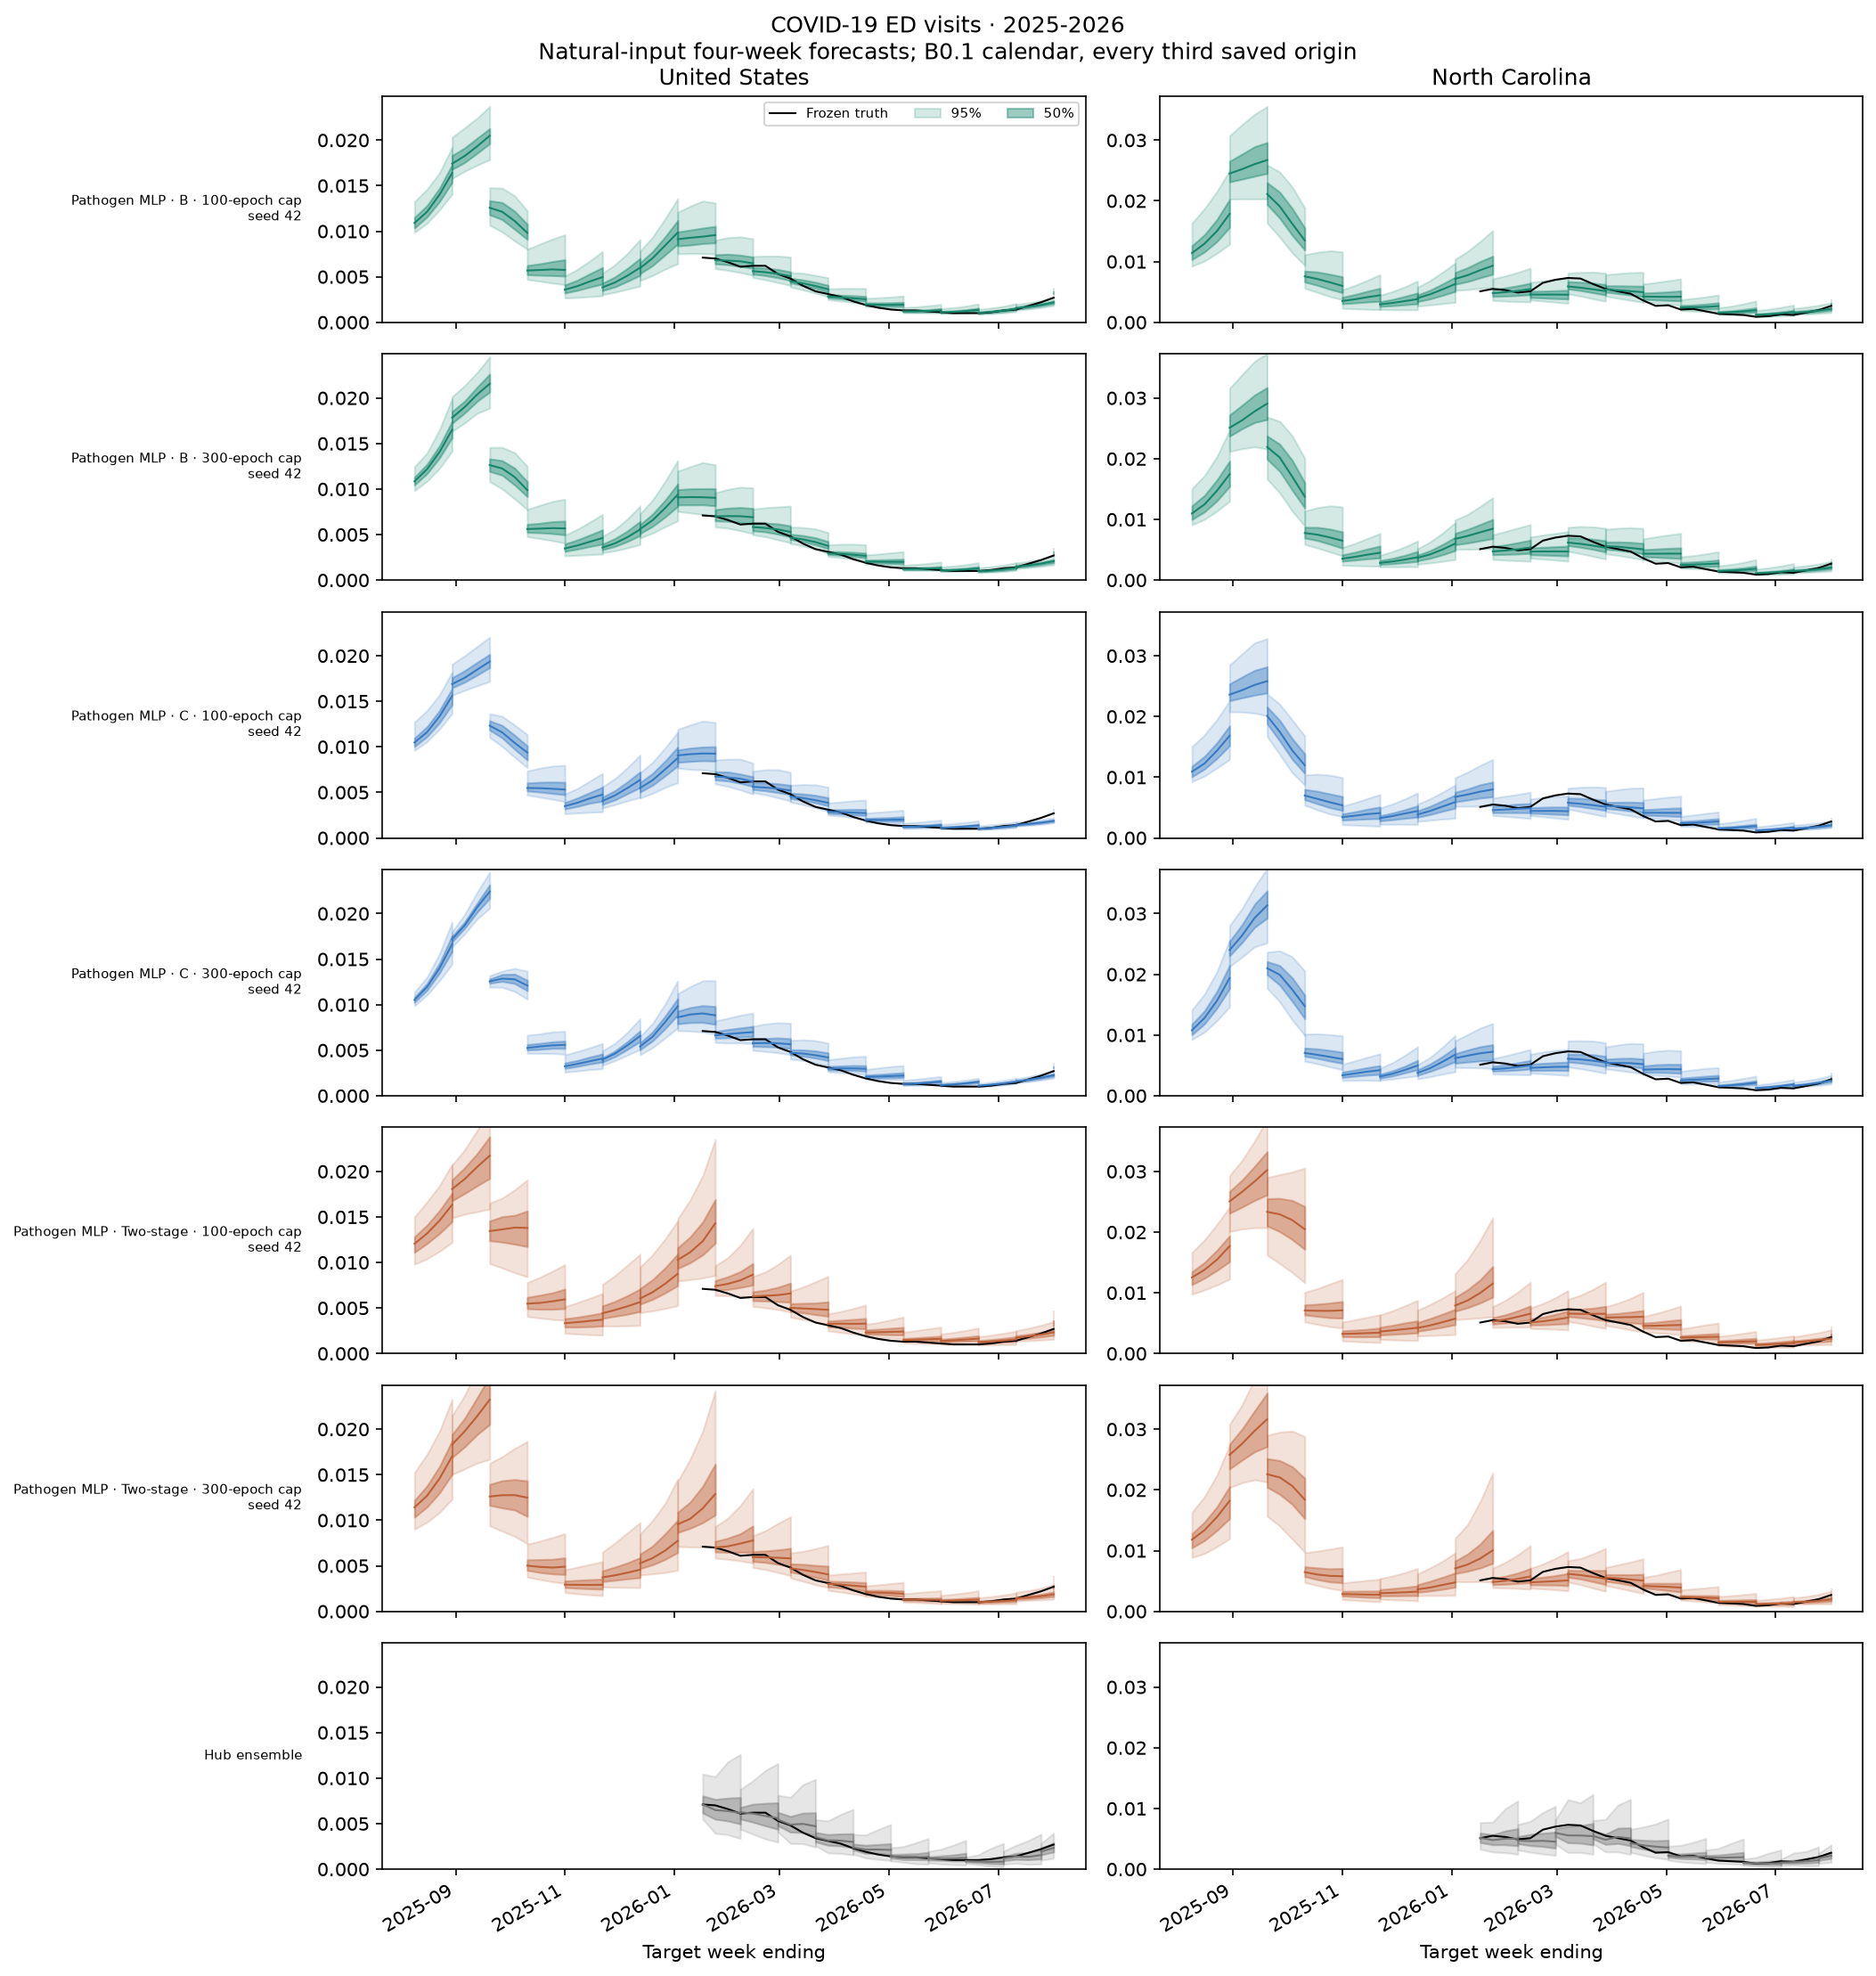
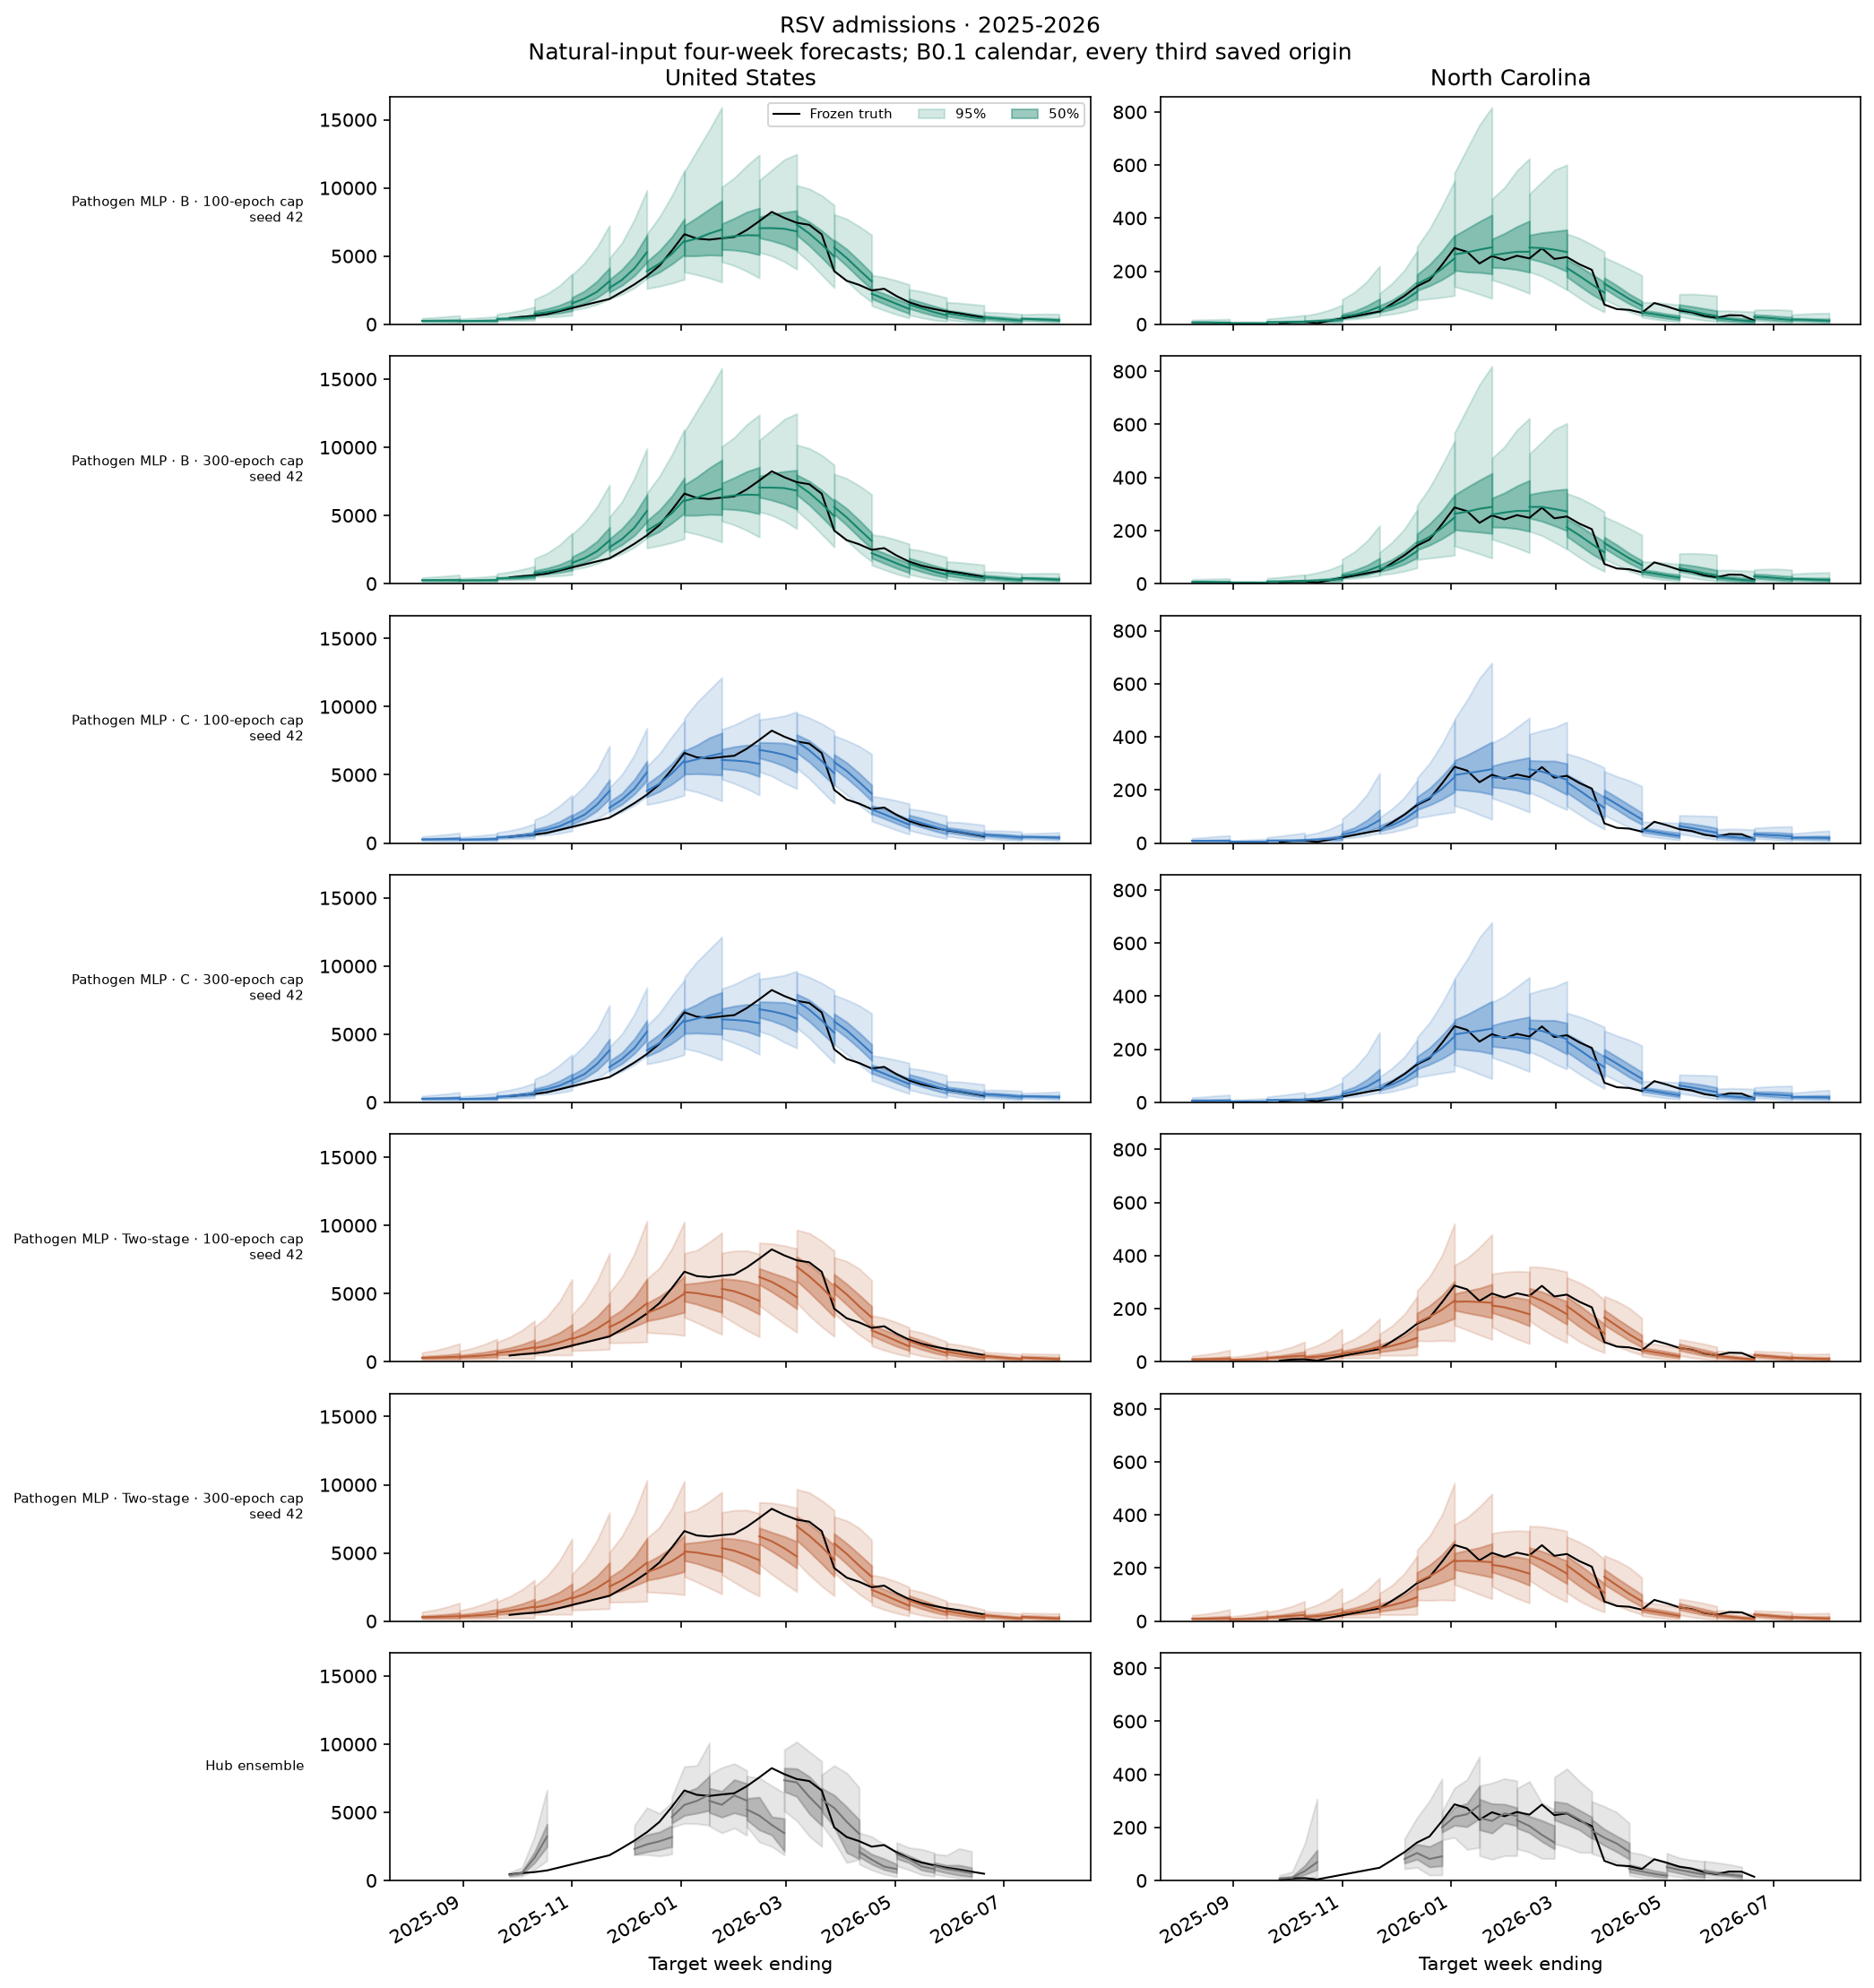
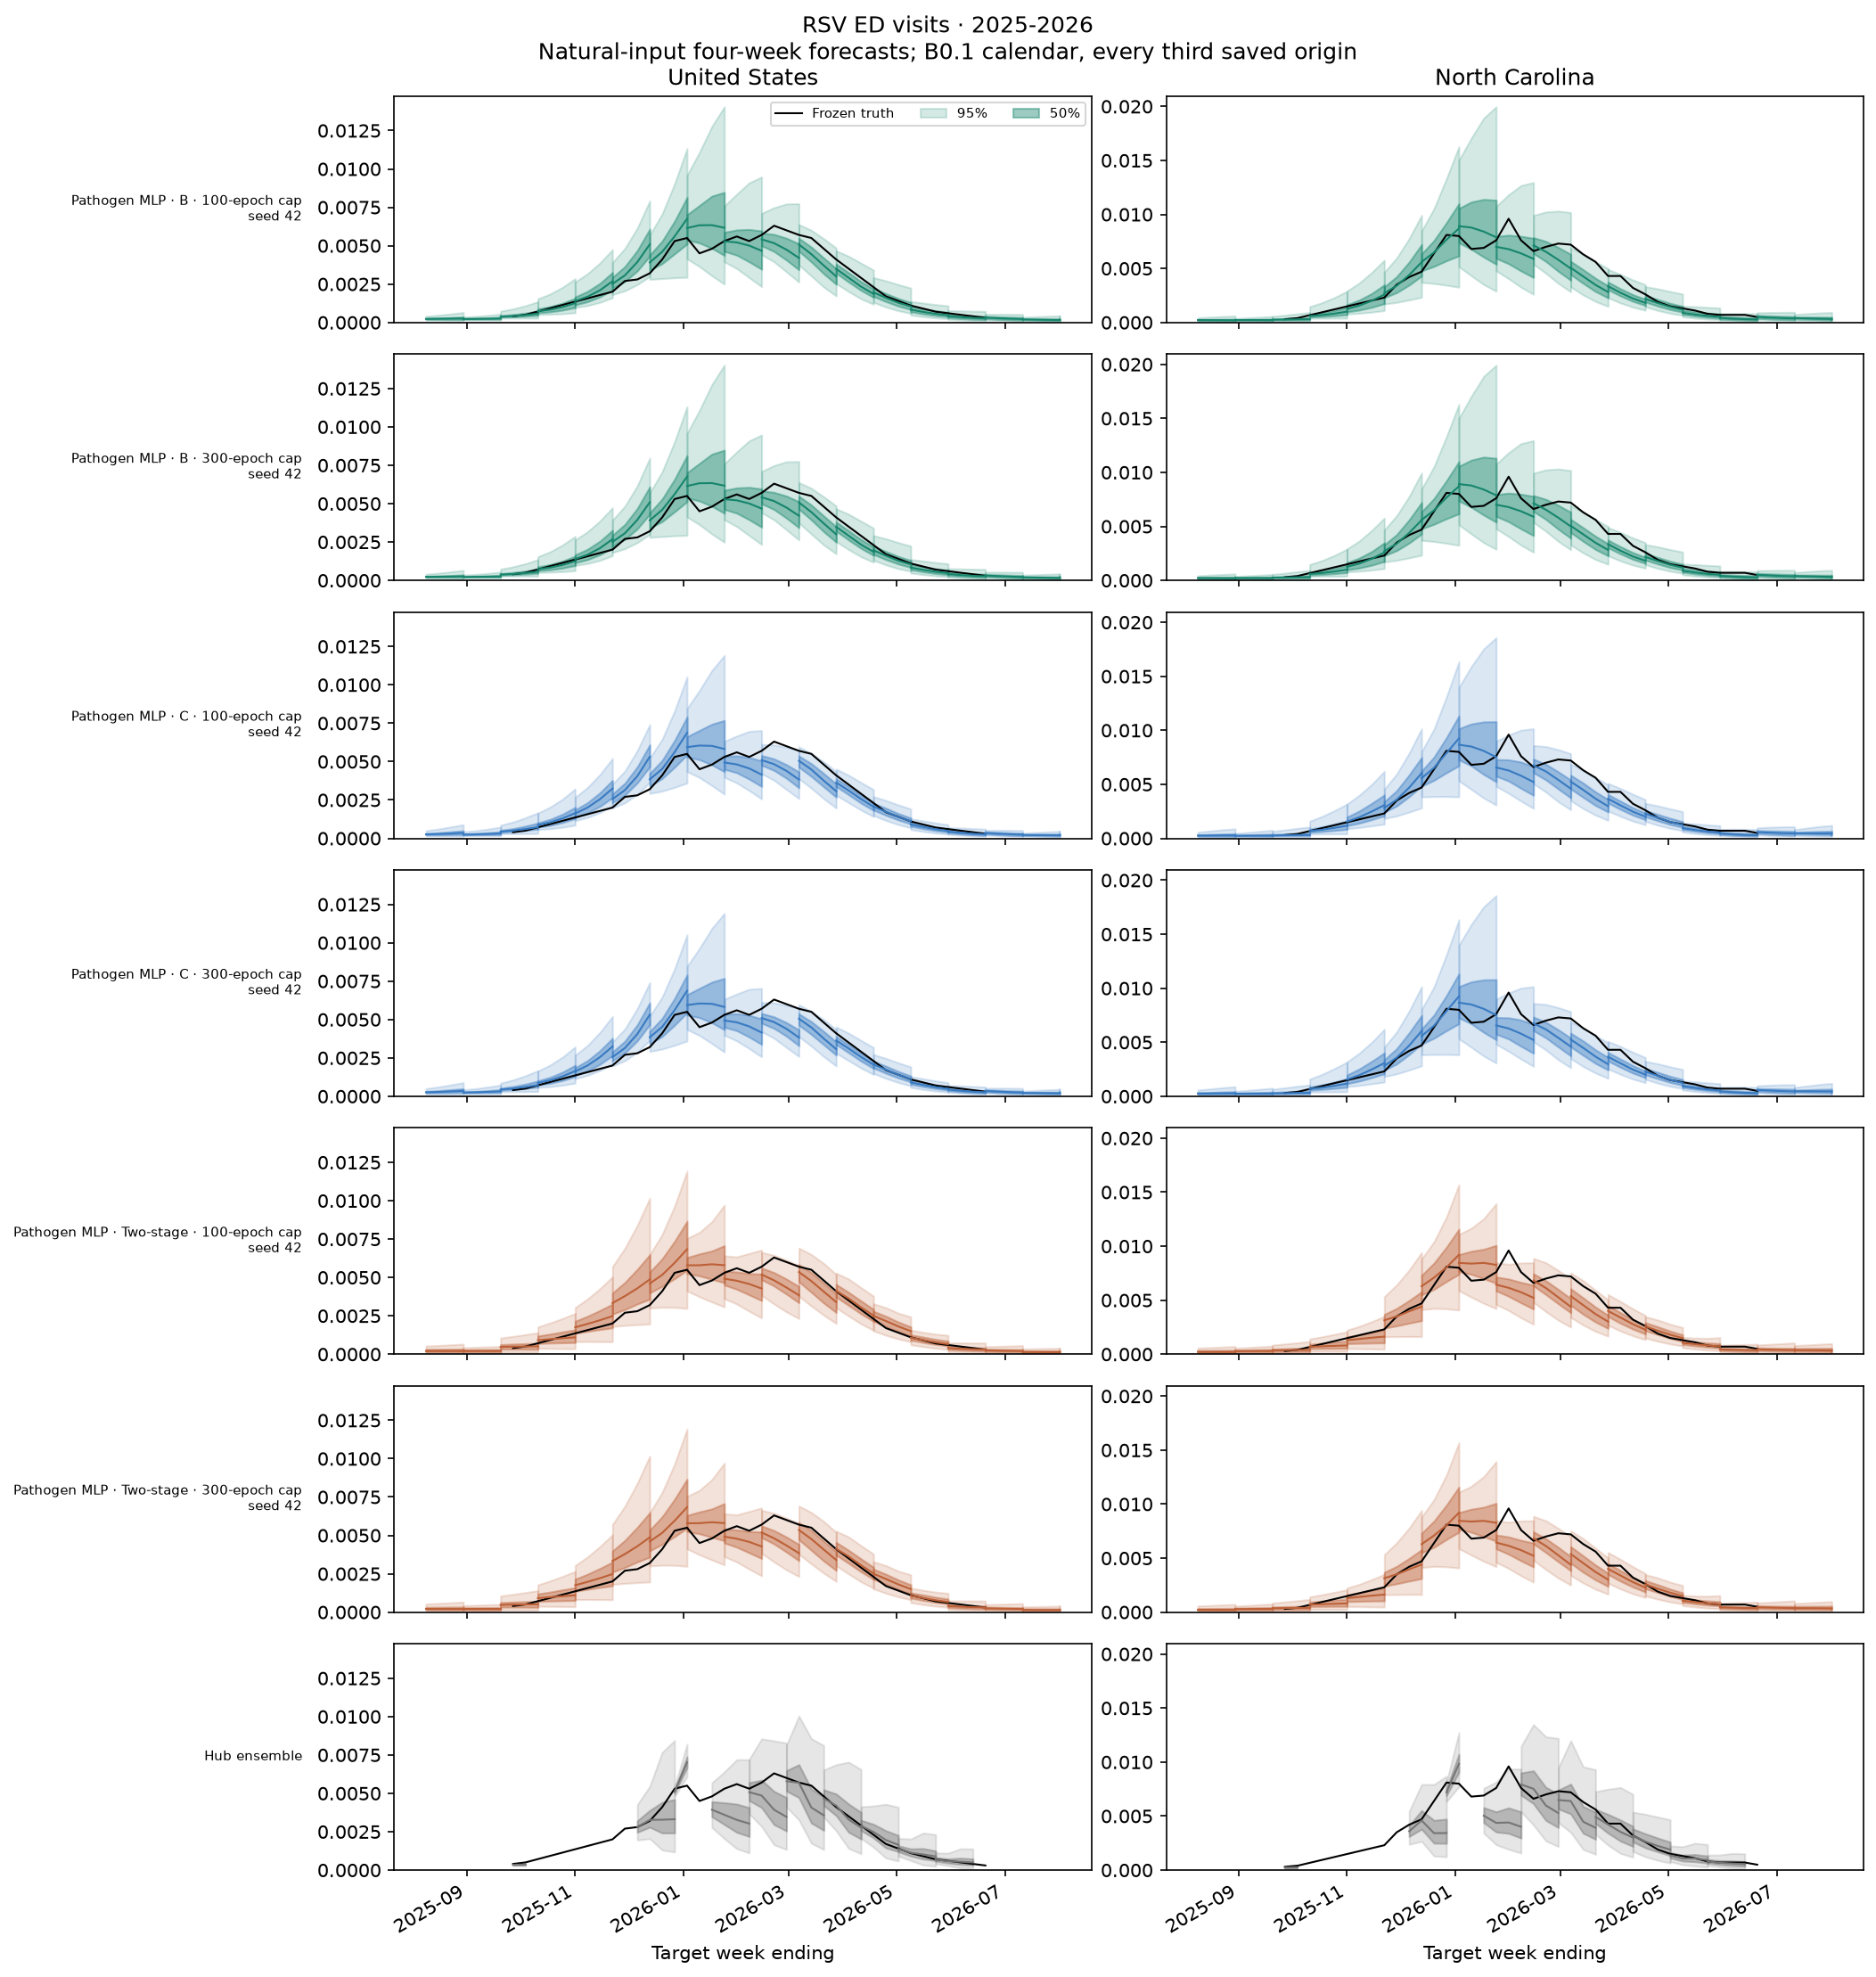
Pathogen MLP B, C, and two-stage at both caps, followed by the Hub ensemble. Every model uses seed 42, the same fixed seed as the original formulation fans. It is illustrative, not an average: pathogen two-stage seed 42 is also the largest observed deterioration, so judge the overall result using all three seeds above. Dates match B0.1's full saved-season calendar; truth and ensemble retain their frozen availability. Missing values are not filled in. Display dates extend beyond scoring support.
Scope, provenance, and reproduction
This remains retrospective development CV on seasons used for model development, not prospective evidence. Three seeds do not resolve small differences. Changing the cap permits longer training and can change checkpoint selection; it does not mean every component trained for 300 epochs. Forecast skill is not a standalone nowcast score.
Matched seed data · Target/season comparisons · Coverage · Snapshot · Run status.
Regenerate from saved scores and forecasts with .venv/bin/python scripts/plot_b1_300.py.
No training or scoring jobs are launched. Original-screen results follow below.
Snapshot and experiment
Generated 2026-09-17T21:23-04:00. 120/120 seed runs complete; status: {'complete': 120}. The page is a snapshot, not a live dashboard. Incomplete averages show their seed count; paired contrasts use only seeds completed on both sides. No missing run receives an imputed score.
Four architectures × ten formulation/masking settings × seeds 42/43/44 = 120 runs, with three held-out season folds per run. Target MLP, pathogen MLP and target convolution use a 100-epoch cap; joint MLP uses 300. All use patience 30 and select then refit. Evaluation uses 256 trajectories and the frozen 23 Hub quantiles. See the screen specification and 300-epoch follow-up.
The score divides model WIS by ensemble WIS within target/season/location, weights states/DC 80% and US 20%, then admissions 1 and ED 0.5 within each season, and averages seasons equally. Lower is better; 1 is ensemble parity. Target support is flu admissions in 2023–24; flu/COVID admissions in 2024–25; and all six targets in 2025–26. Combined skill is not a claim of winning every target or season.
What the formulations mean
| Formulation | Outputs and training |
|---|---|
| A — direct | Forecasts four future weeks; no explicit nowcast output. |
| B — supplied-final flags | Direct forecasts with indicators identifying supplied finalized inputs; no nowcast output. |
| C — auxiliary nowcast | Shared representation, separate recent/future heads, supplied-final flags; forecast loss + 0.25 × recent loss; forecast-only checkpoint selection. |
| Two-stage | Sample recent values and feed them into forecasting; supplied-final flags and exact visible-final bypass; equally weighted recent/future selection loss. |
Independent fits still receive all six input histories. Target models have six components, pathogen models three, joint models one. Each component selects its epoch count separately, then a fresh model refits on all permitted training weeks. Held-out seasons are excluded.
Ranking
| Rank | Configuration | WIS ratio | Seed SD | Seeds / 3 | States/DC | US |
|---|---|---|---|---|---|---|
| 1 | Target MLP · B · gap only | 0.939 | 0.019 | 3 | 0.958 | 0.863 |
| 2 | Pathogen MLP · B · mixed 50% | 0.952 | 0.055 | 3 | 0.971 | 0.875 |
| 3 | Target MLP · B · no masking | 0.953 | 0.035 | 3 | 0.970 | 0.885 |
| 4 | Pathogen MLP · B · no masking | 0.956 | 0.039 | 3 | 0.972 | 0.894 |
| 5 | Pathogen MLP · C · mixed 50% | 0.957 | 0.039 | 3 | 0.975 | 0.885 |
| 6 | Pathogen MLP · B · outage only | 0.964 | 0.034 | 3 | 0.977 | 0.911 |
| 7 | Joint MLP · C · mixed 50% | 0.972 | 0.054 | 3 | 0.980 | 0.941 |
| 8 | Pathogen MLP · B · gap only | 0.975 | 0.028 | 3 | 0.989 | 0.921 |
| 9 | Target convolution · B · gap only | 0.978 | 0.050 | 3 | 0.984 | 0.953 |
| 10 | Target convolution · B · no masking | 0.980 | 0.062 | 3 | 0.982 | 0.972 |
| 11 | Target MLP · B · mixed 50% | 0.980 | 0.042 | 3 | 0.993 | 0.932 |
| 12 | Joint MLP · B · outage only | 0.981 | 0.044 | 3 | 0.985 | 0.967 |
| 13 | Target MLP · B · mixed 25% | 0.982 | 0.052 | 3 | 0.994 | 0.933 |
| 14 | Target MLP · C · mixed 50% | 0.985 | 0.029 | 3 | 0.998 | 0.931 |
| 15 | Joint MLP · B · mixed 50% | 0.990 | 0.054 | 3 | 0.997 | 0.965 |
| 16 | Target convolution · C · mixed 50% | 1.005 | 0.078 | 3 | 1.023 | 0.932 |
| 17 | Target MLP · B · recent only | 1.006 | 0.046 | 3 | 1.016 | 0.969 |
| 18 | Joint MLP · A · mixed 50% | 1.012 | 0.117 | 3 | 1.014 | 1.003 |
| 19 | Pathogen MLP · B · recent only | 1.021 | 0.046 | 3 | 1.029 | 0.991 |
| 20 | Target MLP · C · outage only | 1.025 | 0.088 | 3 | 1.035 | 0.981 |
| 21 | Target MLP · A · mixed 50% | 1.029 | 0.031 | 3 | 1.032 | 1.017 |
| 22 | Target convolution · B · mixed 50% | 1.031 | 0.041 | 3 | 1.044 | 0.980 |
| 23 | Target convolution · B · mixed 25% | 1.037 | 0.071 | 3 | 1.043 | 1.014 |
| 24 | Pathogen MLP · A · mixed 50% | 1.045 | 0.152 | 3 | 1.049 | 1.029 |
| 25 | Target convolution · C · outage only | 1.047 | 0.044 | 3 | 1.061 | 0.990 |
| 26 | Pathogen MLP · B · mixed 25% | 1.053 | 0.014 | 3 | 1.054 | 1.051 |
| 27 | Joint MLP · B · recent only | 1.055 | 0.018 | 3 | 1.048 | 1.086 |
| 28 | Joint MLP · B · gap only | 1.055 | 0.122 | 3 | 1.047 | 1.091 |
| 29 | Joint MLP · B · mixed 25% | 1.058 | 0.074 | 3 | 1.052 | 1.082 |
| 30 | Joint MLP · B · no masking | 1.063 | 0.099 | 3 | 1.056 | 1.093 |
| 31 | Pathogen MLP · C · outage only | 1.067 | 0.069 | 3 | 1.065 | 1.071 |
| 32 | Target convolution · B · recent only | 1.071 | 0.059 | 3 | 1.064 | 1.097 |
| 33 | Target convolution · B · outage only | 1.073 | 0.042 | 3 | 1.084 | 1.028 |
| 34 | Target MLP · B · outage only | 1.092 | 0.222 | 3 | 1.093 | 1.088 |
| 35 | Target convolution · A · mixed 50% | 1.100 | 0.093 | 3 | 1.105 | 1.079 |
| 36 | Pathogen MLP · Two-stage · mixed 50% | 1.104 | 0.025 | 3 | 1.105 | 1.099 |
| 37 | Joint MLP · C · outage only | 1.112 | 0.109 | 3 | 1.107 | 1.129 |
| 38 | Target MLP · Two-stage · mixed 50% | 1.179 | 0.016 | 3 | 1.176 | 1.191 |
| 39 | Target convolution · Two-stage · mixed 50% | 1.206 | 0.062 | 3 | 1.210 | 1.191 |
| 40 | Joint MLP · Two-stage · mixed 50% | 1.211 | 0.081 | 3 | 1.196 | 1.272 |
Seed SD measures variation across the available seeds, not a confidence interval or significance threshold. All 40 configurations · Per-seed scores.
Formulations at matched mixed masking
Every entry uses a 50% probability of corrupting a training episode, with a conditional recent/gap/outage mixture of 50/30/20. Parentheses give completed seeds out of three.
| Architecture | A | B | C | Two-stage |
|---|---|---|---|---|
| Target MLP | 1.029 (3/3) | 0.980 (3/3) | 0.985 (3/3) | 1.179 (3/3) |
| Pathogen MLP | 1.045 (3/3) | 0.952 (3/3) | 0.957 (3/3) | 1.104 (3/3) |
| Target convolution | 1.100 (3/3) | 1.031 (3/3) | 1.005 (3/3) | 1.206 (3/3) |
| Joint MLP | 1.012 (3/3) | 0.990 (3/3) | 0.972 (3/3) | 1.211 (3/3) |
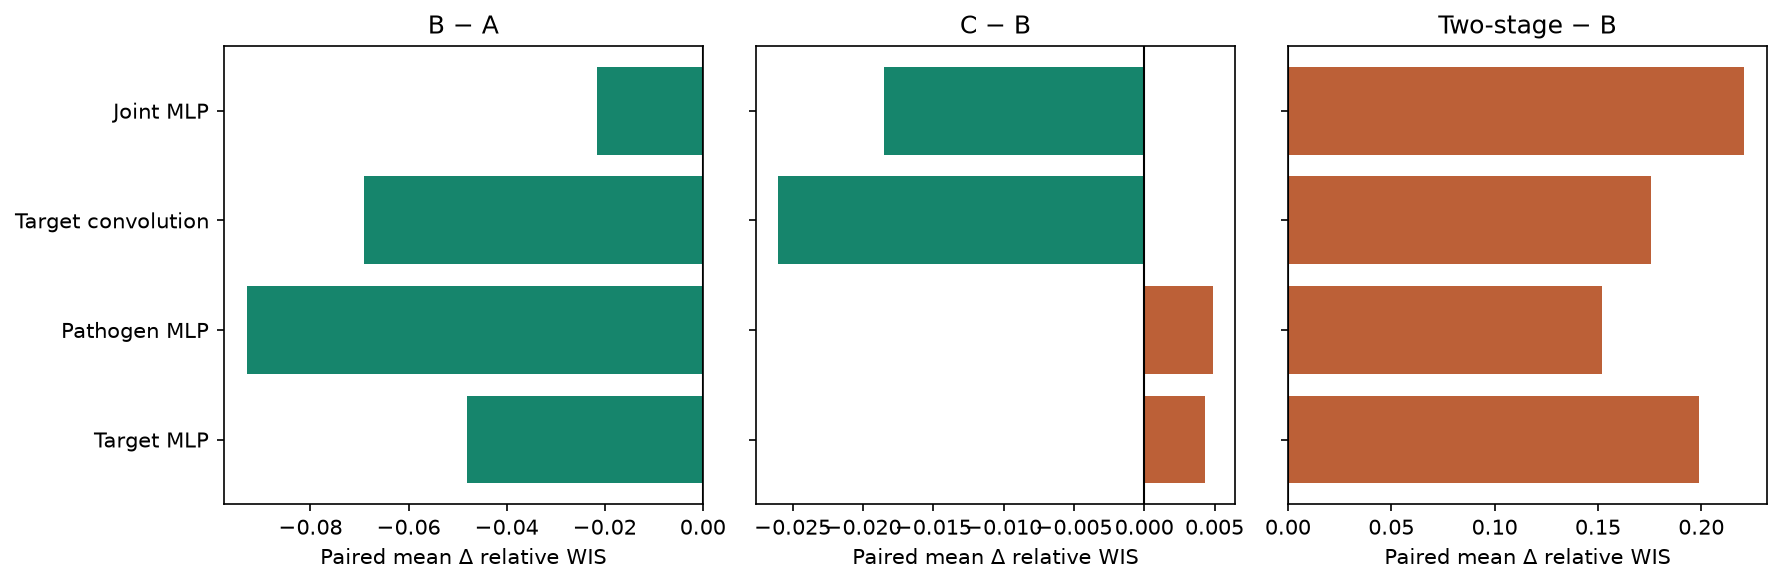
Negative differences favor the first model named in the contrast (for example, C in C − B). These compare the complete formulations: the two-stage/B contrast changes the decoder, anchoring, and loss weighting as well as feedback.
| Architecture | Contrast | Paired seeds | Mean Δ WIS | Seed Δ SD | Seeds improved |
|---|---|---|---|---|---|
| Target MLP | B − A | 3 | -0.048 | 0.021 | 3 |
| Target MLP | C − B | 3 | 0.004 | 0.017 | 1 |
| Target MLP | Two-stage − B | 3 | 0.199 | 0.030 | 0 |
| Pathogen MLP | B − A | 3 | -0.093 | 0.100 | 3 |
| Pathogen MLP | C − B | 3 | 0.005 | 0.023 | 2 |
| Pathogen MLP | Two-stage − B | 3 | 0.152 | 0.059 | 0 |
| Target convolution | B − A | 3 | -0.069 | 0.070 | 3 |
| Target convolution | C − B | 3 | -0.026 | 0.053 | 2 |
| Target convolution | Two-stage − B | 3 | 0.175 | 0.101 | 0 |
| Joint MLP | B − A | 3 | -0.022 | 0.170 | 1 |
| Joint MLP | C − B | 3 | -0.018 | 0.001 | 3 |
| Joint MLP | Two-stage − B | 3 | 0.221 | 0.031 | 0 |
What works, what does not
Supplied-final flags are the most consistent improvement over direct forecasting. B lowers mean WIS versus A in 4/4 architectures, by 0.022–0.093. The target MLP, pathogen MLP and target convolution improve on all three matched seeds; the joint MLP improves on only one seed despite its better mean, so that contrast is less stable.
Auxiliary nowcasting is competitive, not a general failure. At mixed masking 50%, C scores 0.957 versus B's 0.952 for pathogen MLP. The target MLP also changes little. C improves mean WIS for the target convolution and joint MLP; the joint comparison improves on all three seeds. These results do not establish that producing a nowcast is itself the cause: C changes the training objective as well as the outputs.
Two-stage is worse on natural inputs in every matched architecture and seed. Its mean penalty relative to B is 0.152–0.221. This is evidence against the current complete two-stage formulation for natural-input forecasting. It does not identify whether the problem is training duration, decoder/anchoring, objective weighting, or feeding recent estimates into the forecast. Those remain separate hypotheses.
There is no universally best masking recipe. Gap-only B wins overall for target MLP; mixed 50% B wins within pathogen MLP. Training without artificial masking is competitive in both families. The 25% setting is not an intermediate step in a monotonic improvement curve. Masking changes validation as well as training, so these are recipe comparisons, not isolated regularization effects.
Natural-input winners are not necessarily the most robust to outages. The overall winner moves from 0.939 naturally to 1.716 under a full-channel outage. Two-stage target MLP and target convolution have lower outage scores than their B counterparts, despite losing on natural inputs. The following matched panel makes that tradeoff explicit; all values are forecast WIS relative to the original, uncorrupted ensemble baseline.
| Architecture | A | B | C | Two-stage |
|---|---|---|---|---|
| Target MLP | 1.650 | 1.645 | 1.617 | 1.432 |
| Pathogen MLP | 1.671 | 1.652 | 1.645 | 1.681 |
| Target convolution | 1.734 | 1.709 | 1.675 | 1.323 |
| Joint MLP | 1.669 | 1.651 | 1.648 | 1.787 |
Calibration still needs work. The winning model's weighted 50% and 95% coverage are 41.9% and 85.2%. Winning on WIS does not mean its uncertainty intervals are calibrated.
For the next decision, retain the best natural-input B recipes, C as a competitive formulation, and the two-stage outage tradeoff. Use the 300-epoch experiment to test the training-budget explanation before changing the architecture or loss. Do not select a universal winner from small mean differences over only three seeds.
Masking around B
Mask rates are episode probabilities, not percentages of cells. Natural missingness remains in every configuration. A recent mask hides recent observations across locations; a gap hides a short channel/location block; an outage removes a channel across the full context. Validation masks follow the candidate mixture, so these comparisons change both training and checkpoint-selection conditions.
| Architecture | None | Mixed 25% | Mixed 50% | Recent only | Gap only | Outage only |
|---|---|---|---|---|---|---|
| Target MLP | 0.953 (3/3) | 0.982 (3/3) | 0.980 (3/3) | 1.006 (3/3) | 0.939 (3/3) | 1.092 (3/3) |
| Pathogen MLP | 0.956 (3/3) | 1.053 (3/3) | 0.952 (3/3) | 1.021 (3/3) | 0.975 (3/3) | 0.964 (3/3) |
| Target convolution | 0.980 (3/3) | 1.037 (3/3) | 1.031 (3/3) | 1.071 (3/3) | 0.978 (3/3) | 1.073 (3/3) |
| Joint MLP | 1.063 (3/3) | 1.058 (3/3) | 0.990 (3/3) | 1.055 (3/3) | 1.055 (3/3) | 0.981 (3/3) |
Held-out stress diagnostics
These scores use the same frozen target cells and unchanged Hub ensemble denominator, but artificially hide model inputs. They are robustness diagnostics, not additional independent evaluations or a comparison against an ensemble subjected to the same corruption.
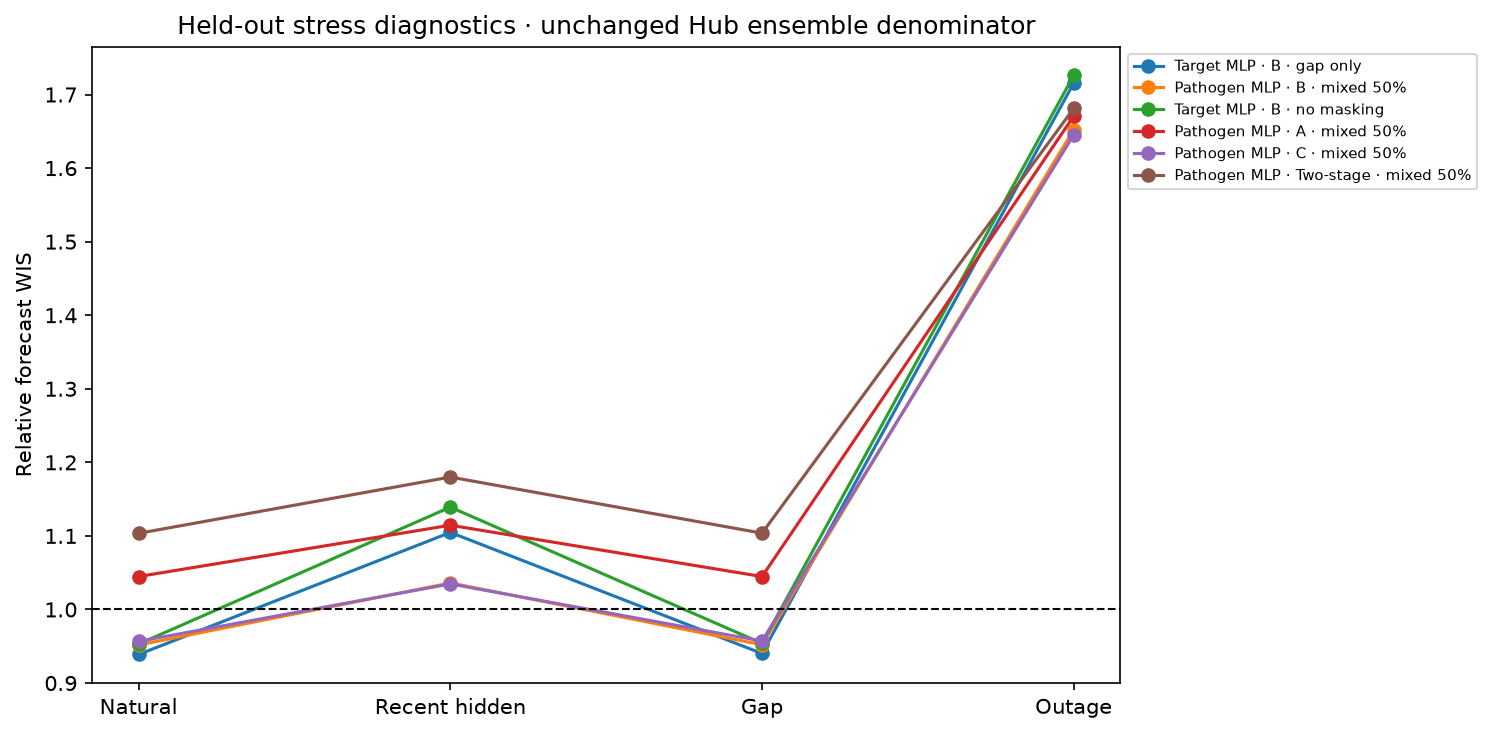
| Configuration | gap | natural | outage | recent |
|---|---|---|---|---|
| Target MLP · B · gap only | 0.940 | 0.939 | 1.716 | 1.105 |
| Pathogen MLP · B · mixed 50% | 0.952 | 0.952 | 1.652 | 1.036 |
| Target MLP · B · no masking | 0.954 | 0.953 | 1.726 | 1.139 |
| Pathogen MLP · A · mixed 50% | 1.045 | 1.045 | 1.671 | 1.115 |
| Pathogen MLP · C · mixed 50% | 0.957 | 0.957 | 1.645 | 1.035 |
| Pathogen MLP · Two-stage · mixed 50% | 1.104 | 1.104 | 1.681 | 1.180 |
Target, season, geography, and calibration
The combined score can hide different behavior by pathogen or season. The panels below use only available frozen Hub support; an absent target/season combination is not filled in.
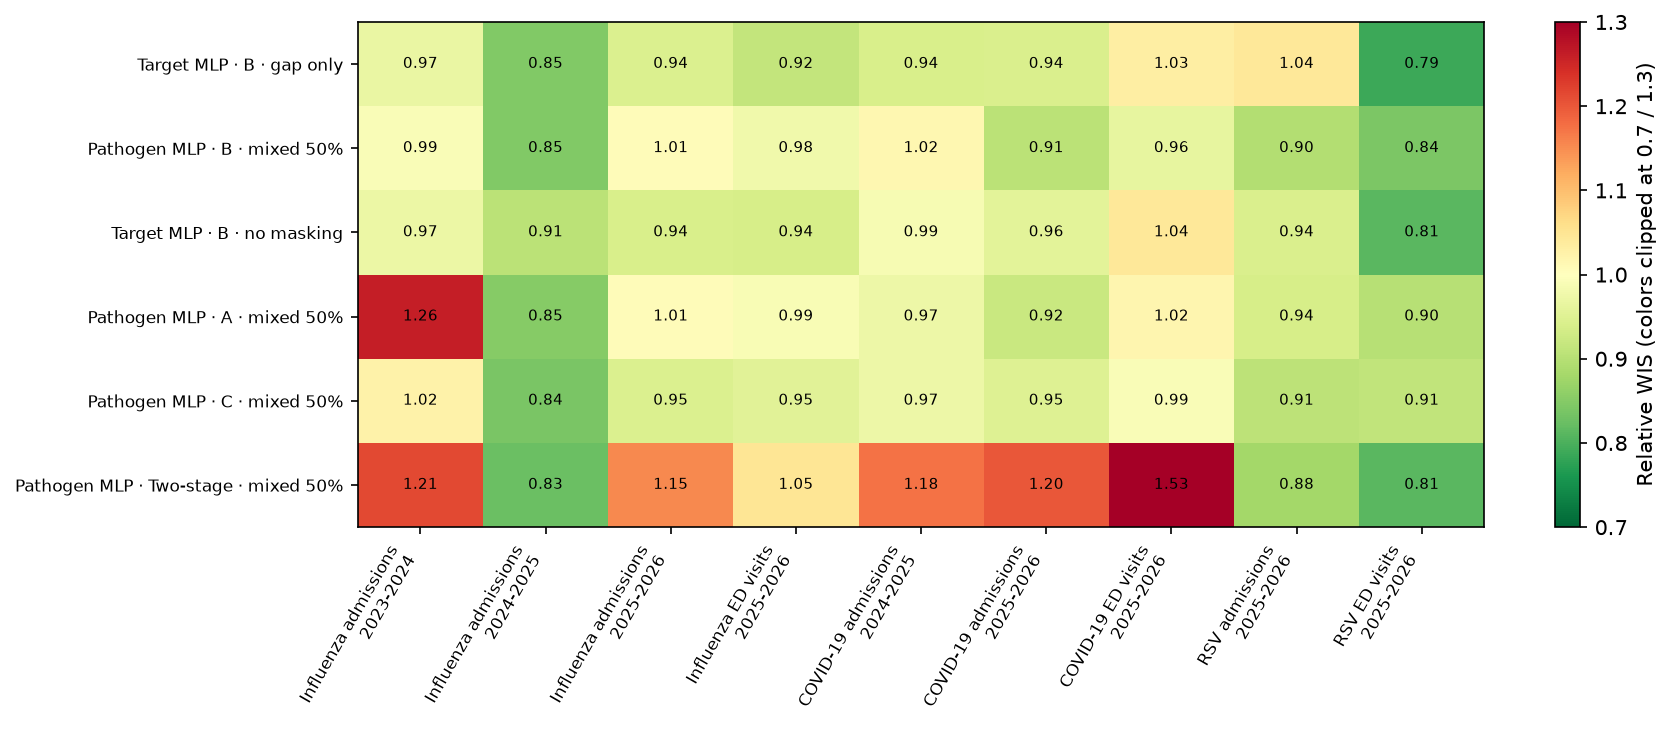
Where the gains and failures occur
The overall leader uses target MLP, B, gap-only masking. The other columns fix pathogen MLP and mixed 50% masking; values average all three seeds. These are the nine available target/season cases, not nine equally weighted contributions to the combined score: seasons receive equal weight and targets are weighted within seasons.
| Season | Target | Overall leader | Pathogen B | Pathogen C | Pathogen two-stage |
|---|---|---|---|---|---|
| 2023-2024 | Influenza admissions | 0.968 | 0.991 | 1.023 | 1.215 |
| 2024-2025 | Influenza admissions | 0.847 | 0.847 | 0.841 | 0.826 |
| 2025-2026 | Influenza admissions | 0.944 | 1.006 | 0.945 | 1.153 |
| 2025-2026 | Influenza ED visits | 0.915 | 0.978 | 0.953 | 1.049 |
| 2024-2025 | COVID-19 admissions | 0.940 | 1.016 | 0.973 | 1.175 |
| 2025-2026 | COVID-19 admissions | 0.943 | 0.905 | 0.950 | 1.200 |
| 2025-2026 | COVID-19 ED visits | 1.032 | 0.964 | 0.992 | 1.532 |
| 2025-2026 | RSV admissions | 1.044 | 0.895 | 0.907 | 0.880 |
| 2025-2026 | RSV ED visits | 0.787 | 0.842 | 0.911 | 0.810 |
The overall leader still loses to the ensemble on RSV admissions and COVID ED in 2025–26. Its strongest case-level gains are RSV ED in 2025–26 and flu admissions in 2024–25. Pathogen C improves on B for flu admissions in 2025–26 while losing ground on COVID admissions and RSV ED that season; the similar combined scores therefore conceal meaningful differences across targets.
The pathogen two-stage model's failures are concentrated in flu admissions in 2023–24 and COVID admissions/ED and flu admissions in 2025–26. It remains competitive on flu admissions in 2024–25 and RSV in 2025–26. These score-based observations do not identify whether bias, spread, or timing causes those failures.
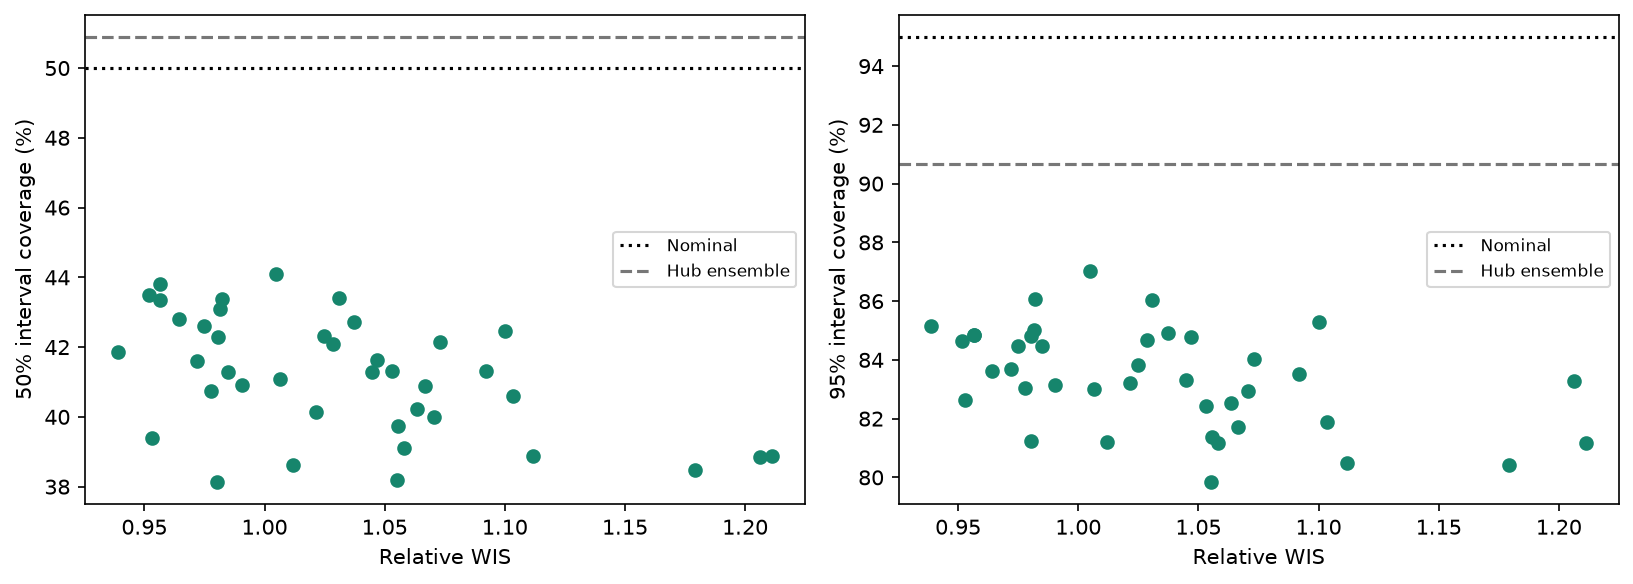
Coverage here uses the same geography, target and season weighting as the combined score, then averages seeds. It is a diagnostic, not an alternative ranking objective. Coverage below nominal can reflect bias, narrow intervals, or both; these plots alone do not isolate the cause. Coverage data · Target/season scores.
Training budget and the 300-epoch question
For the matched pathogen-MLP formulation panel:
| Formulation | Selections | Hit cap | Best epoch ≥90 |
|---|---|---|---|
| A | 27 | 17 | 6 |
| B | 27 | 18 | 9 |
| C | 27 | 17 | 13 |
| Two-stage | 27 | 19 | 15 |
Hitting a cap, or selecting a late epoch, suggests that a longer budget merits testing; it does not establish undertraining as the cause of poor held-out WIS. Selection loss differs between formulations and cannot be read as the final Hub WIS. The separate follow-up raises the cap to 300 while retaining patience 30, three seeds, four formulations, and all four architectures. Joint MLP already had cap 300, so its repeats are controls rather than a cap contrast.
Fan plots
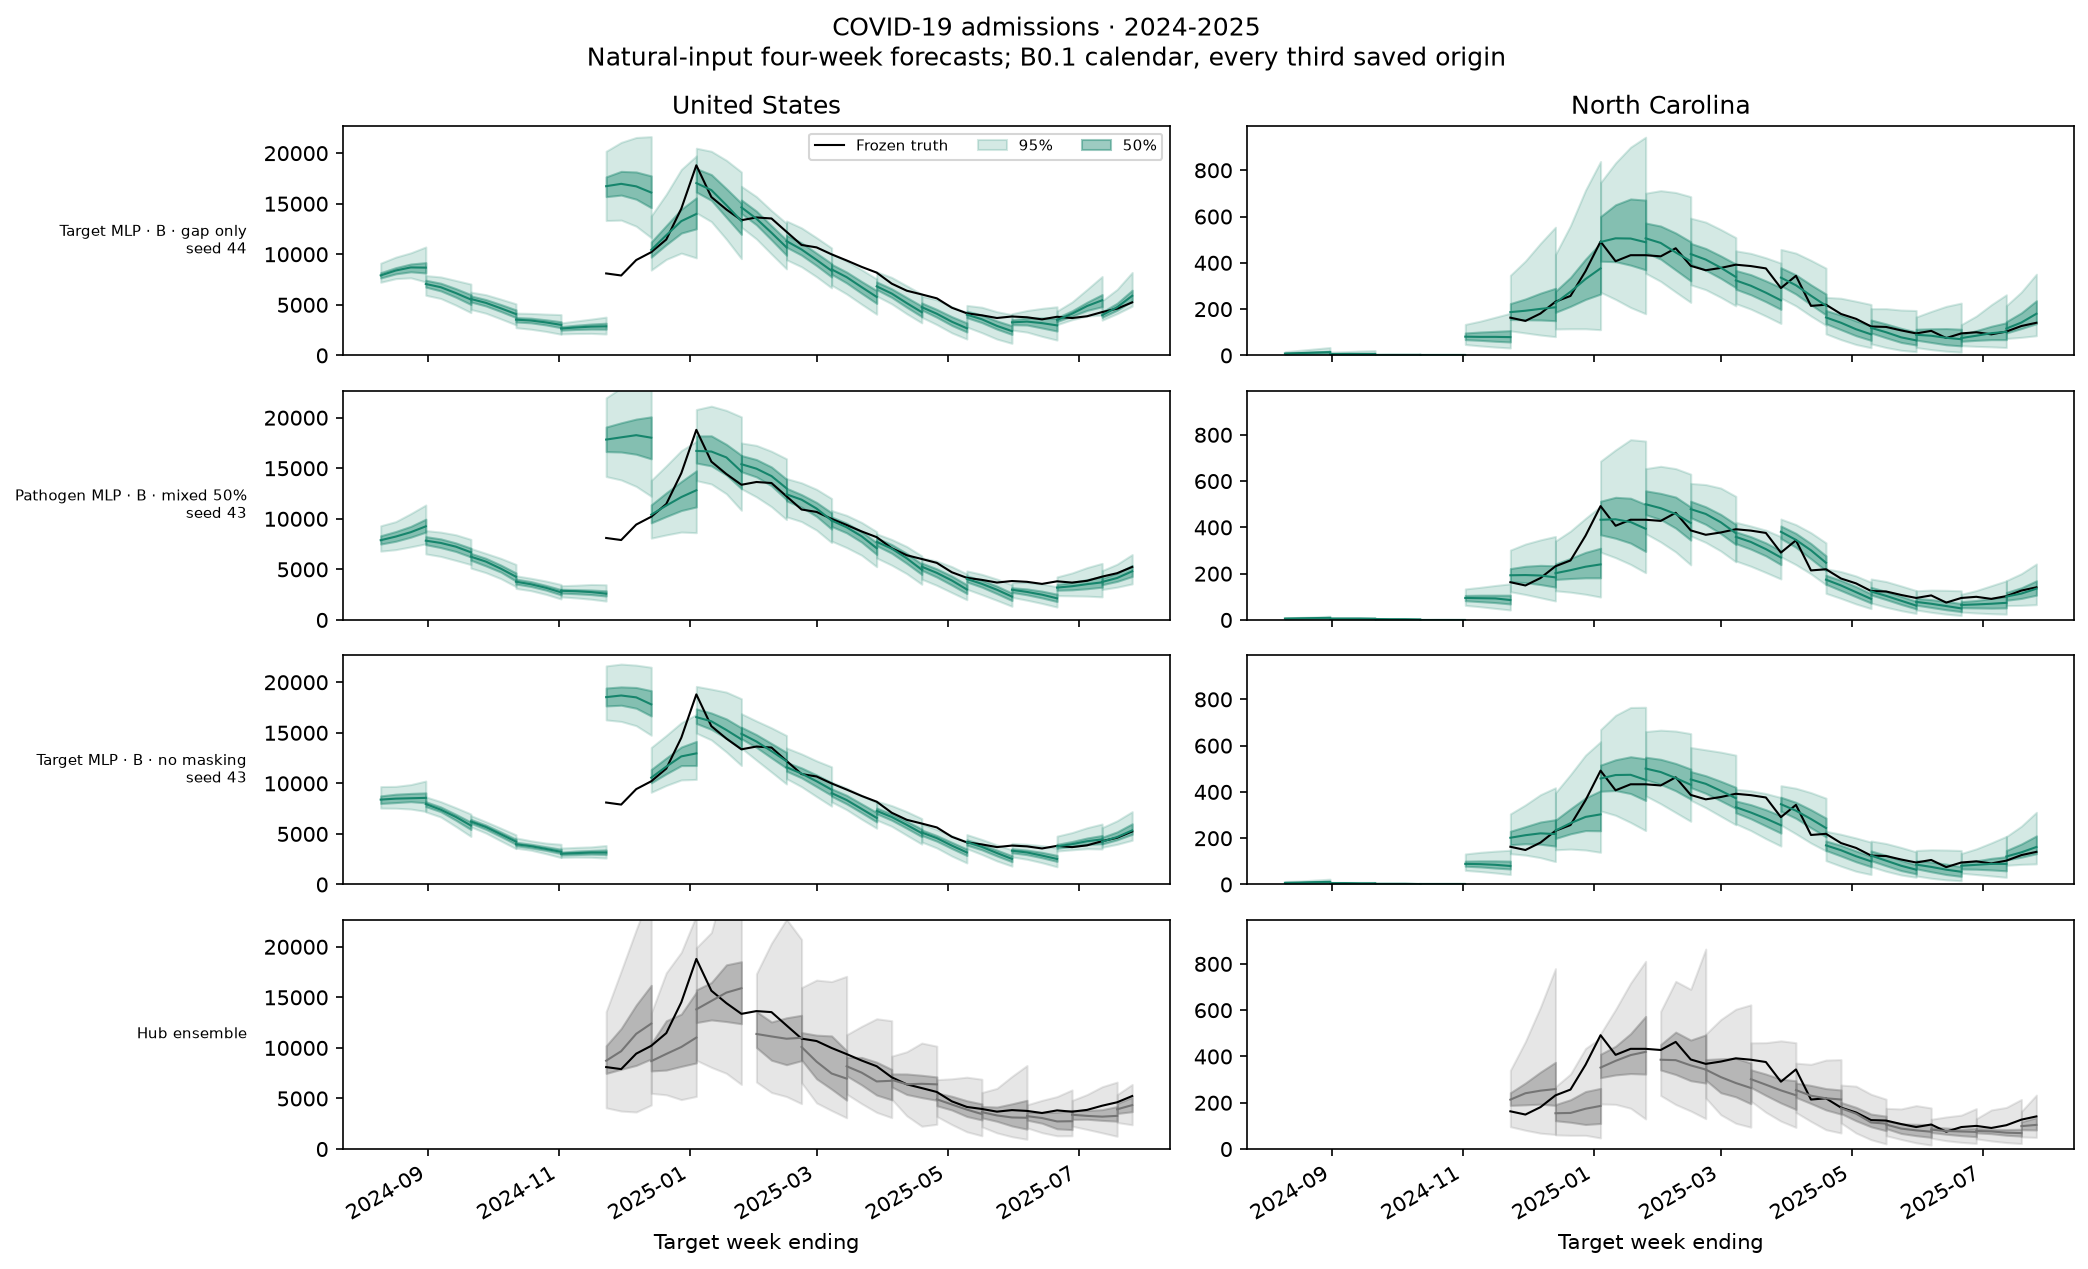
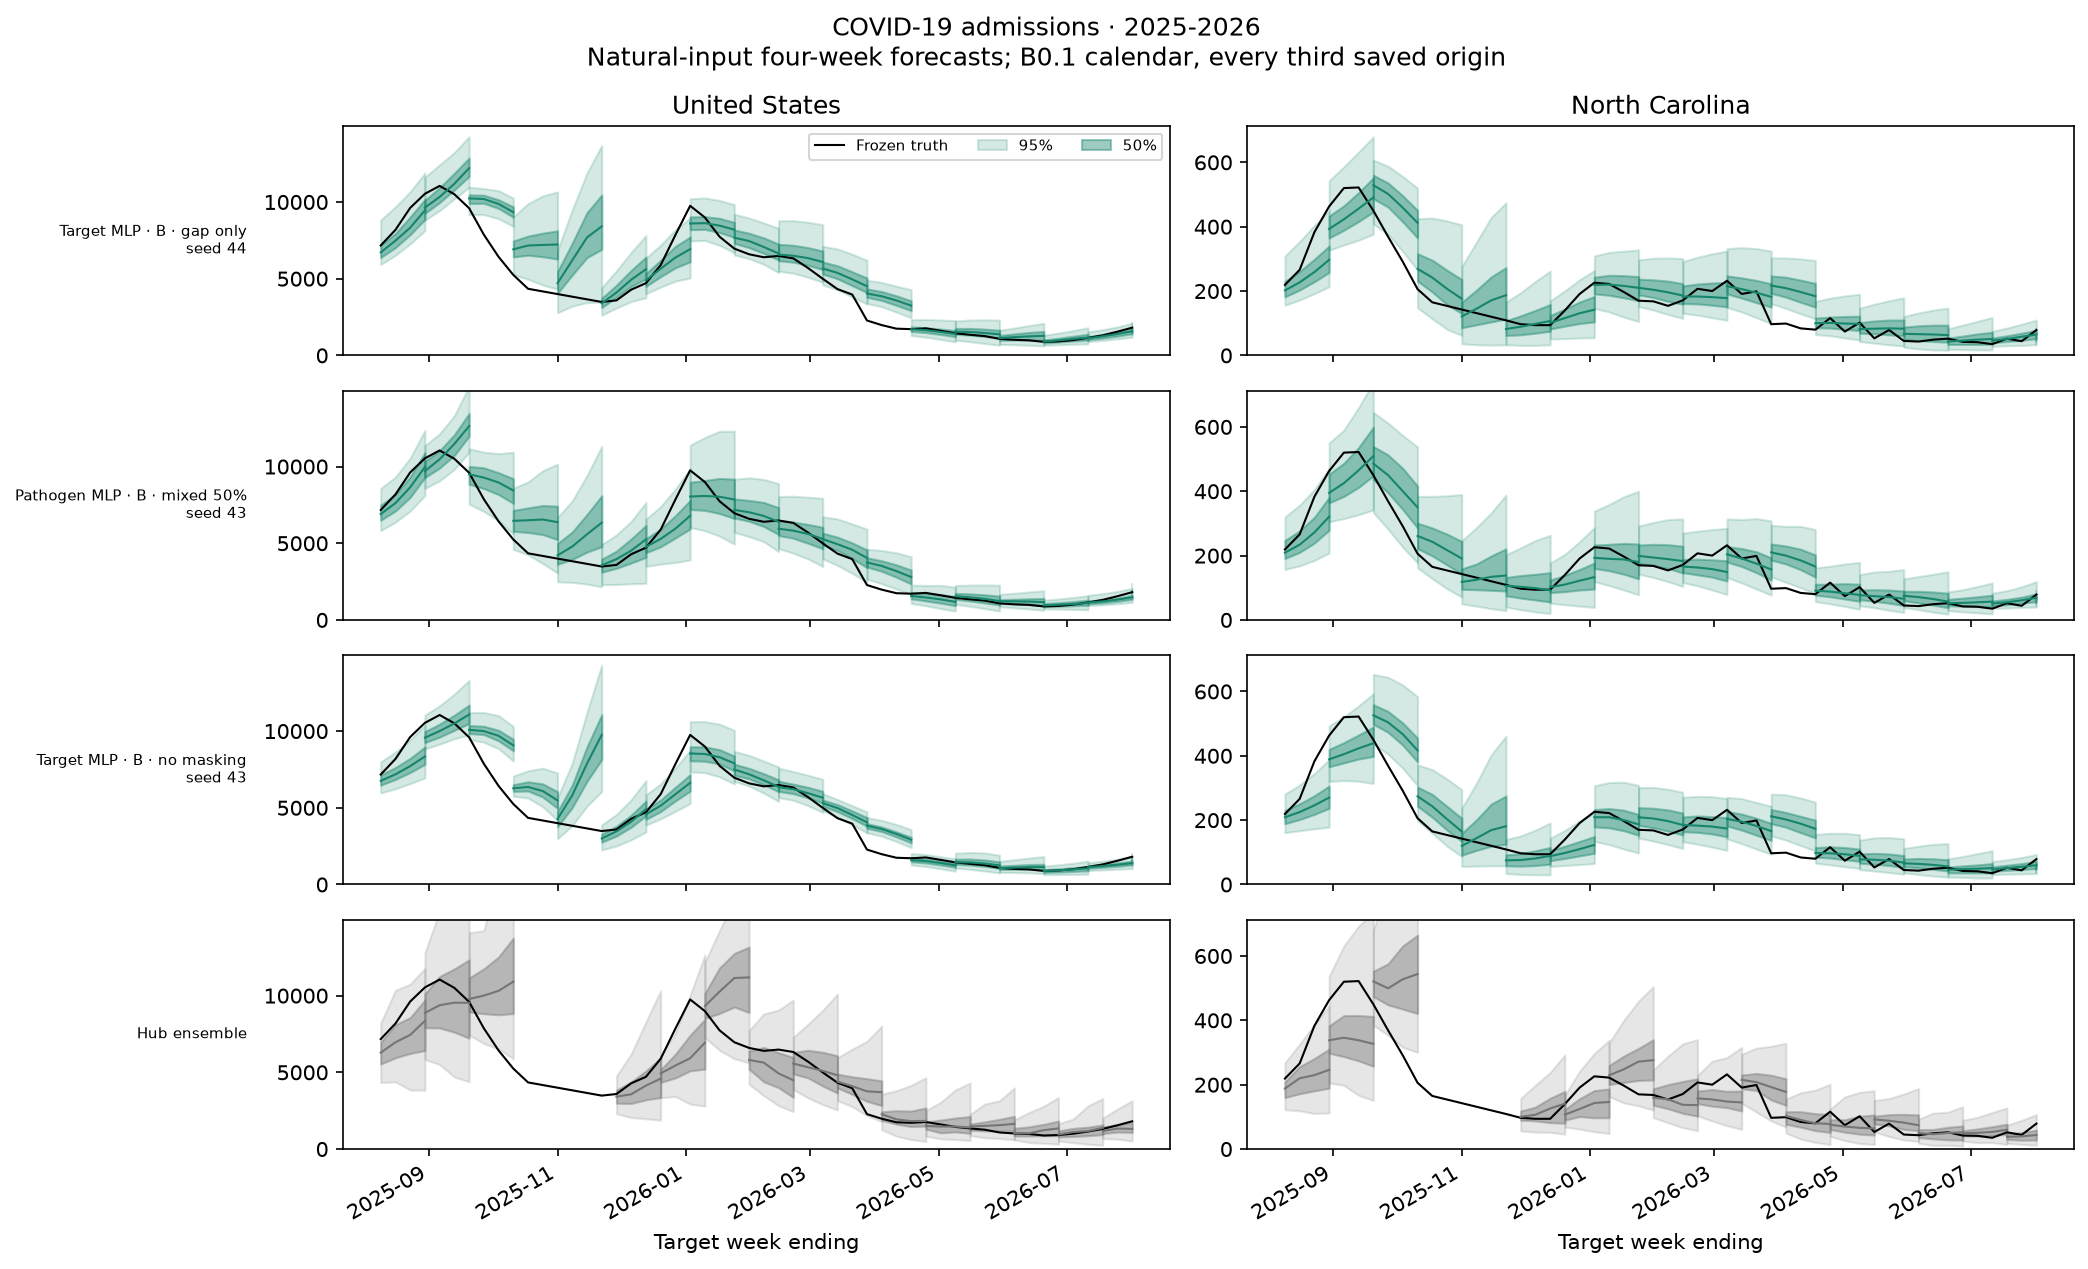
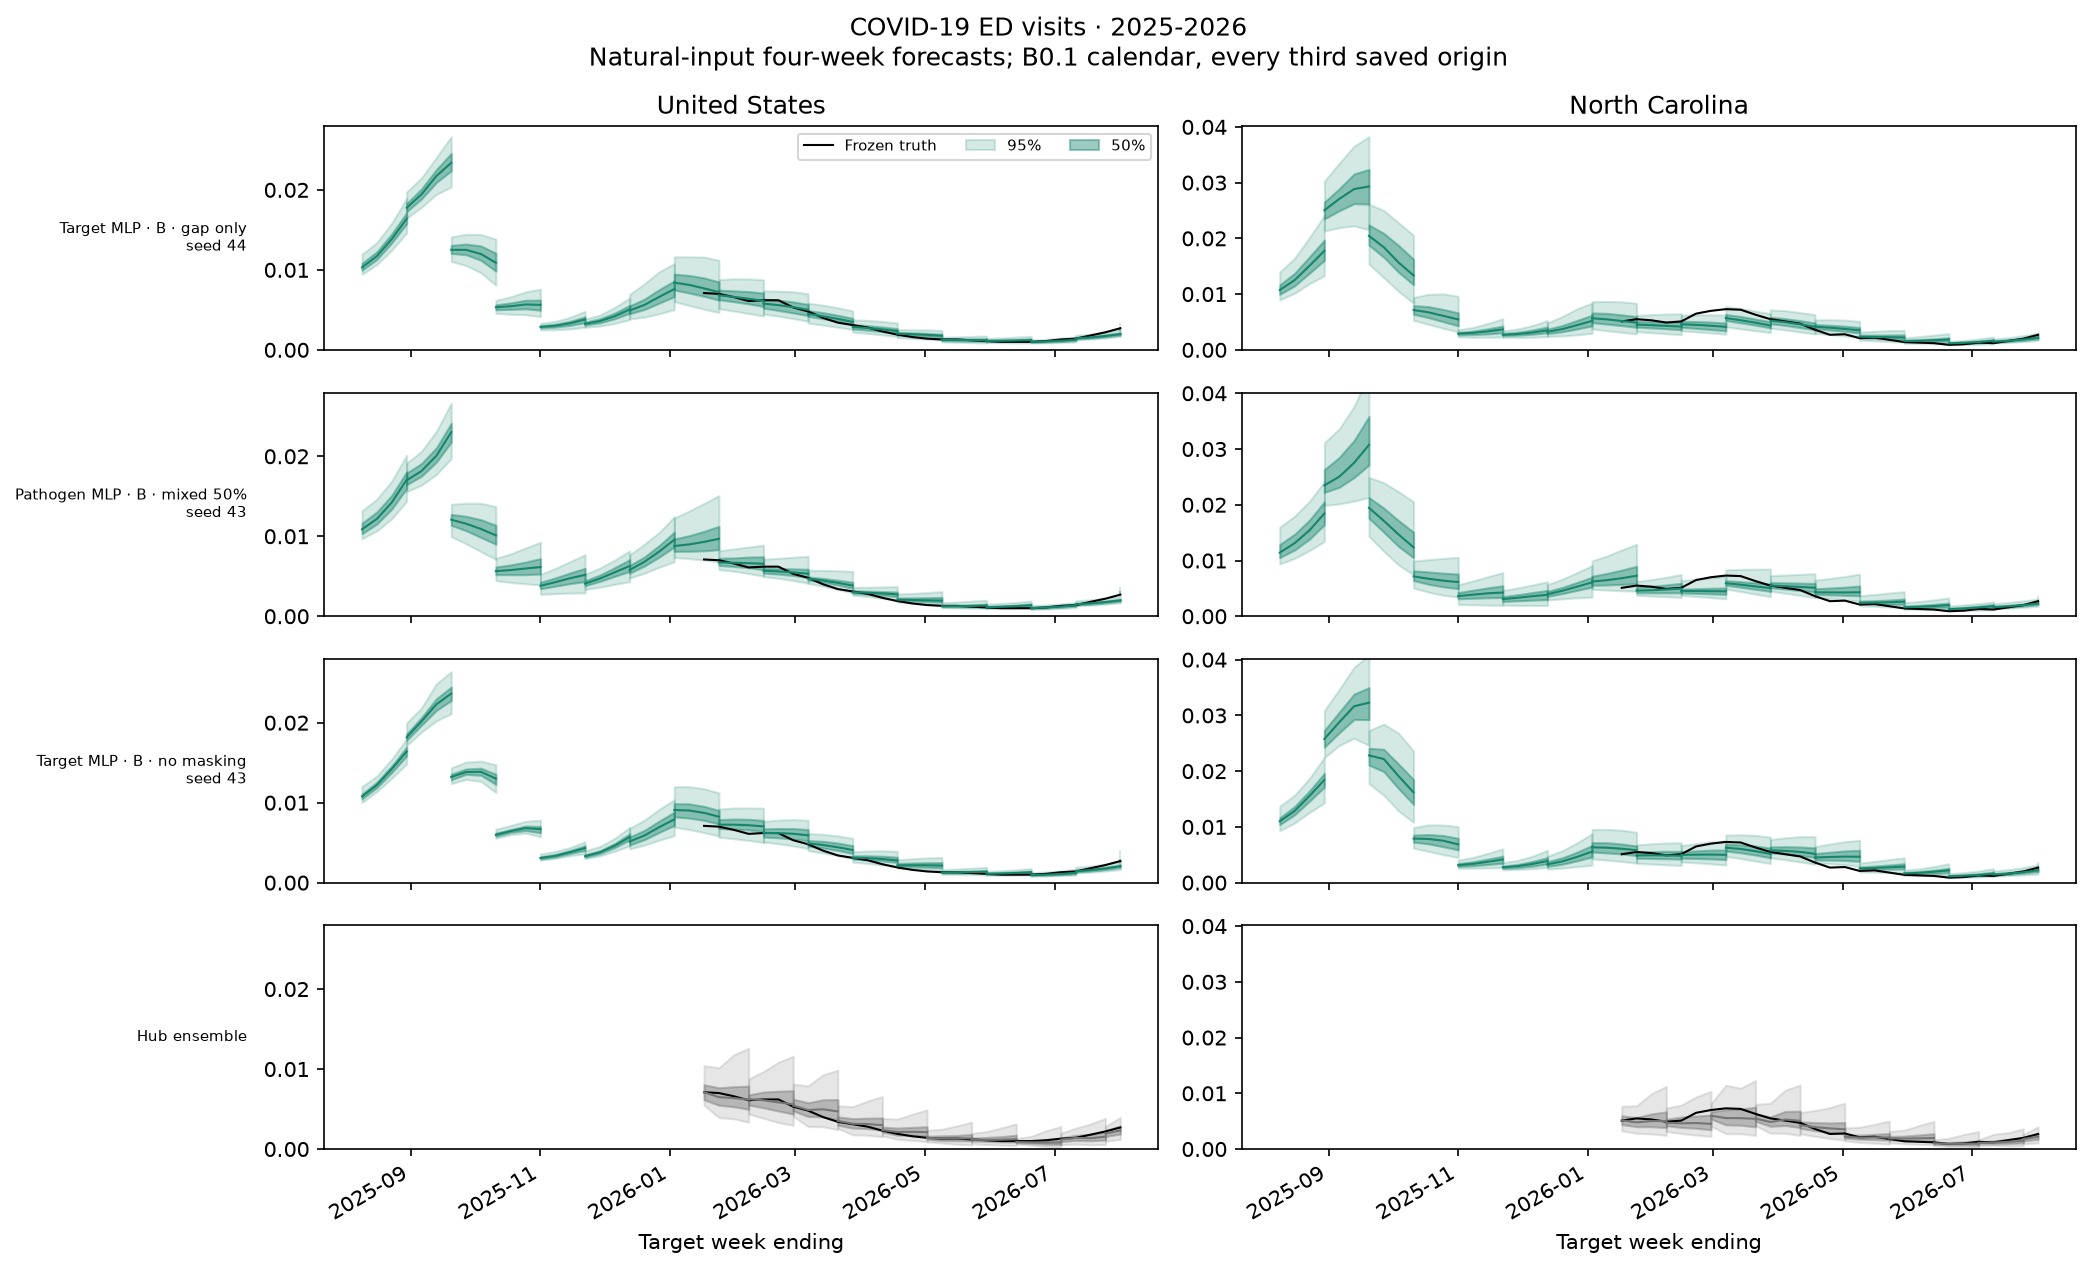
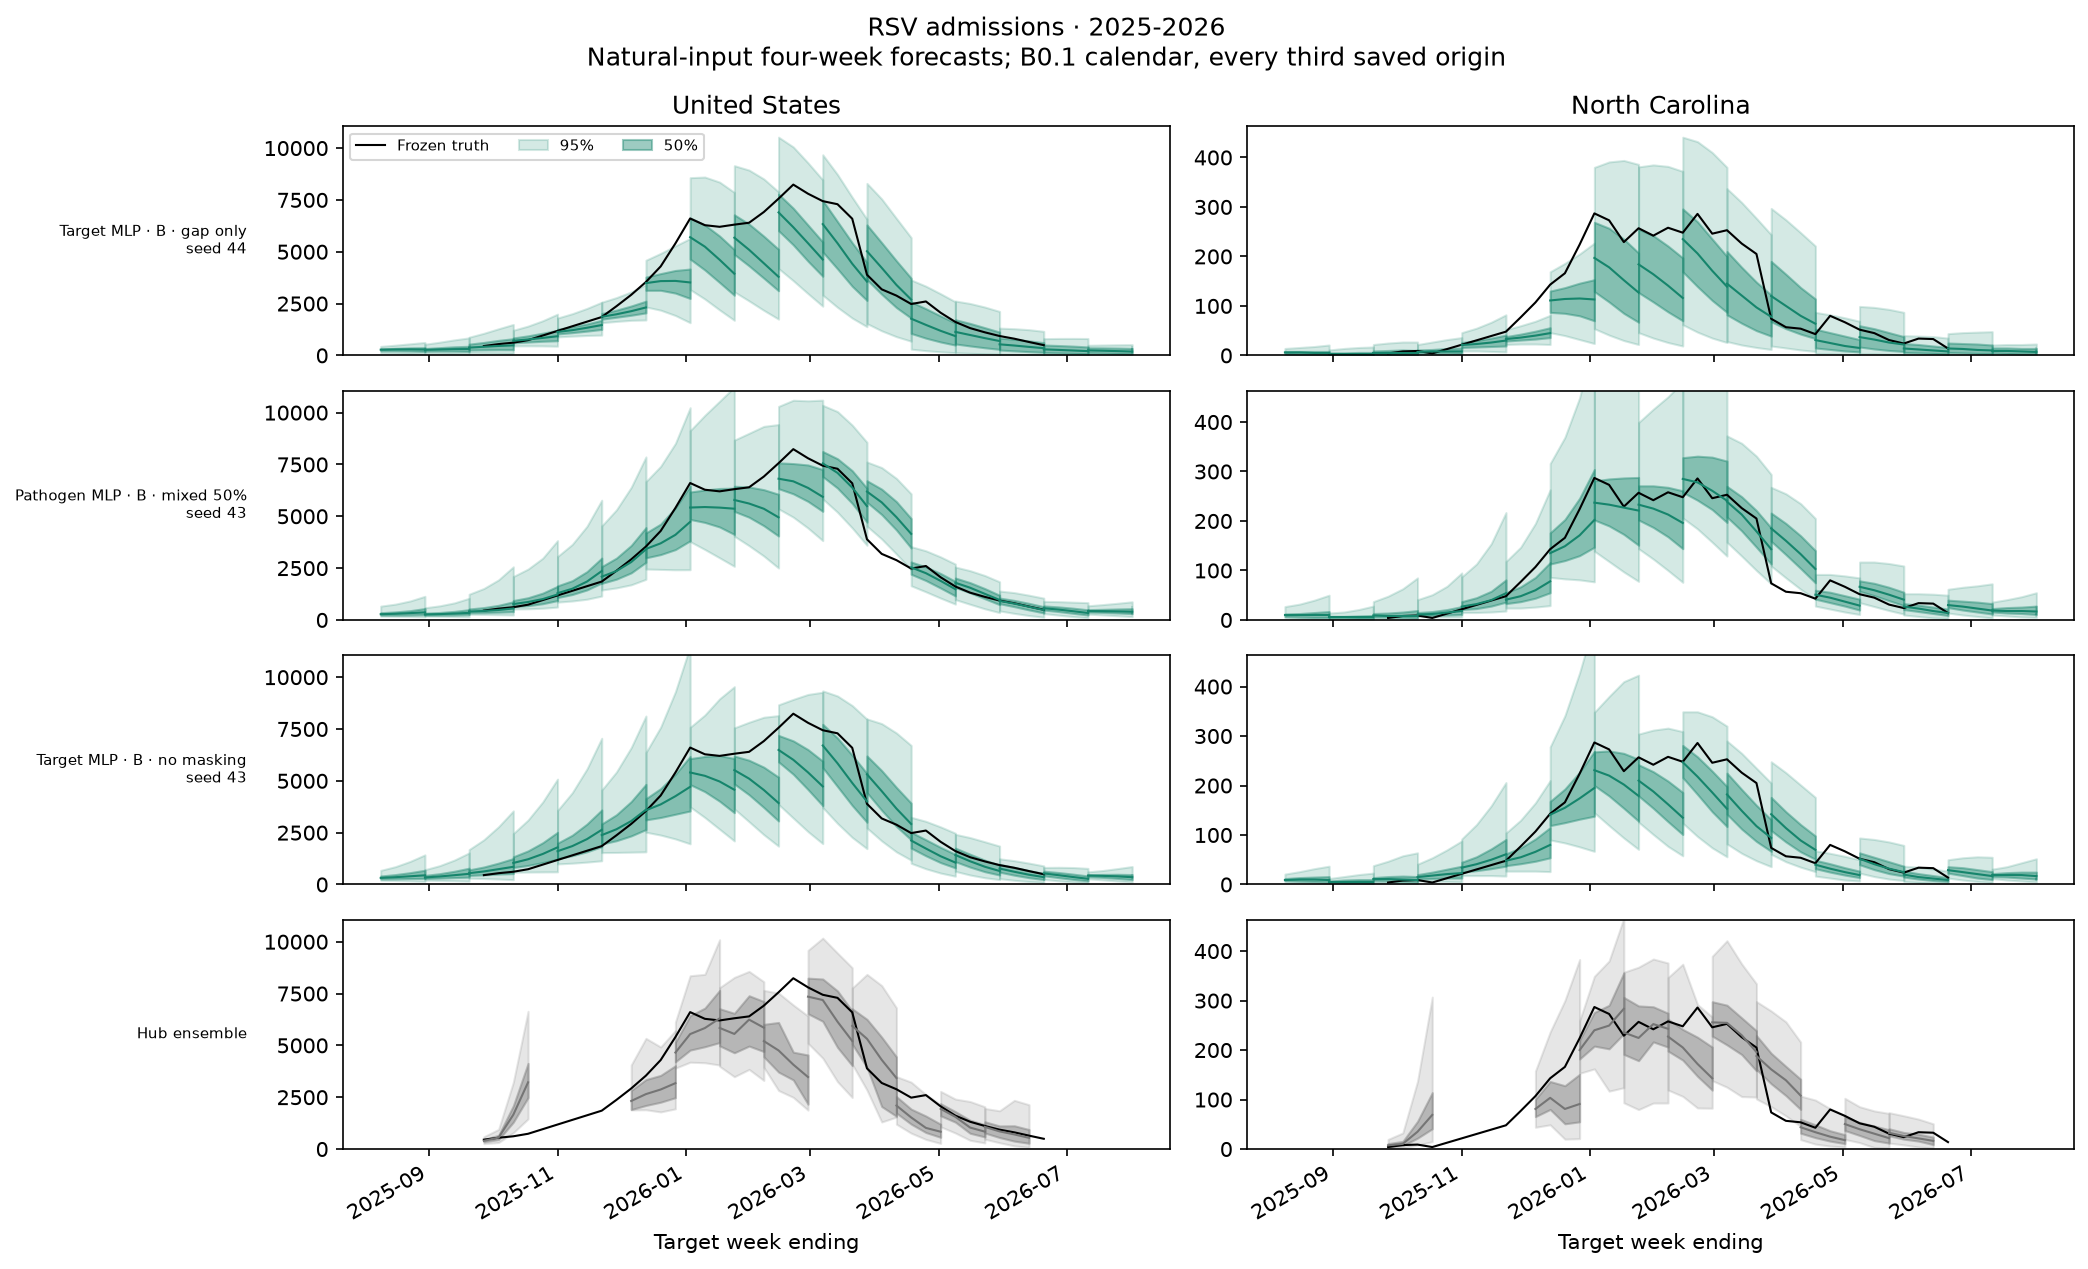
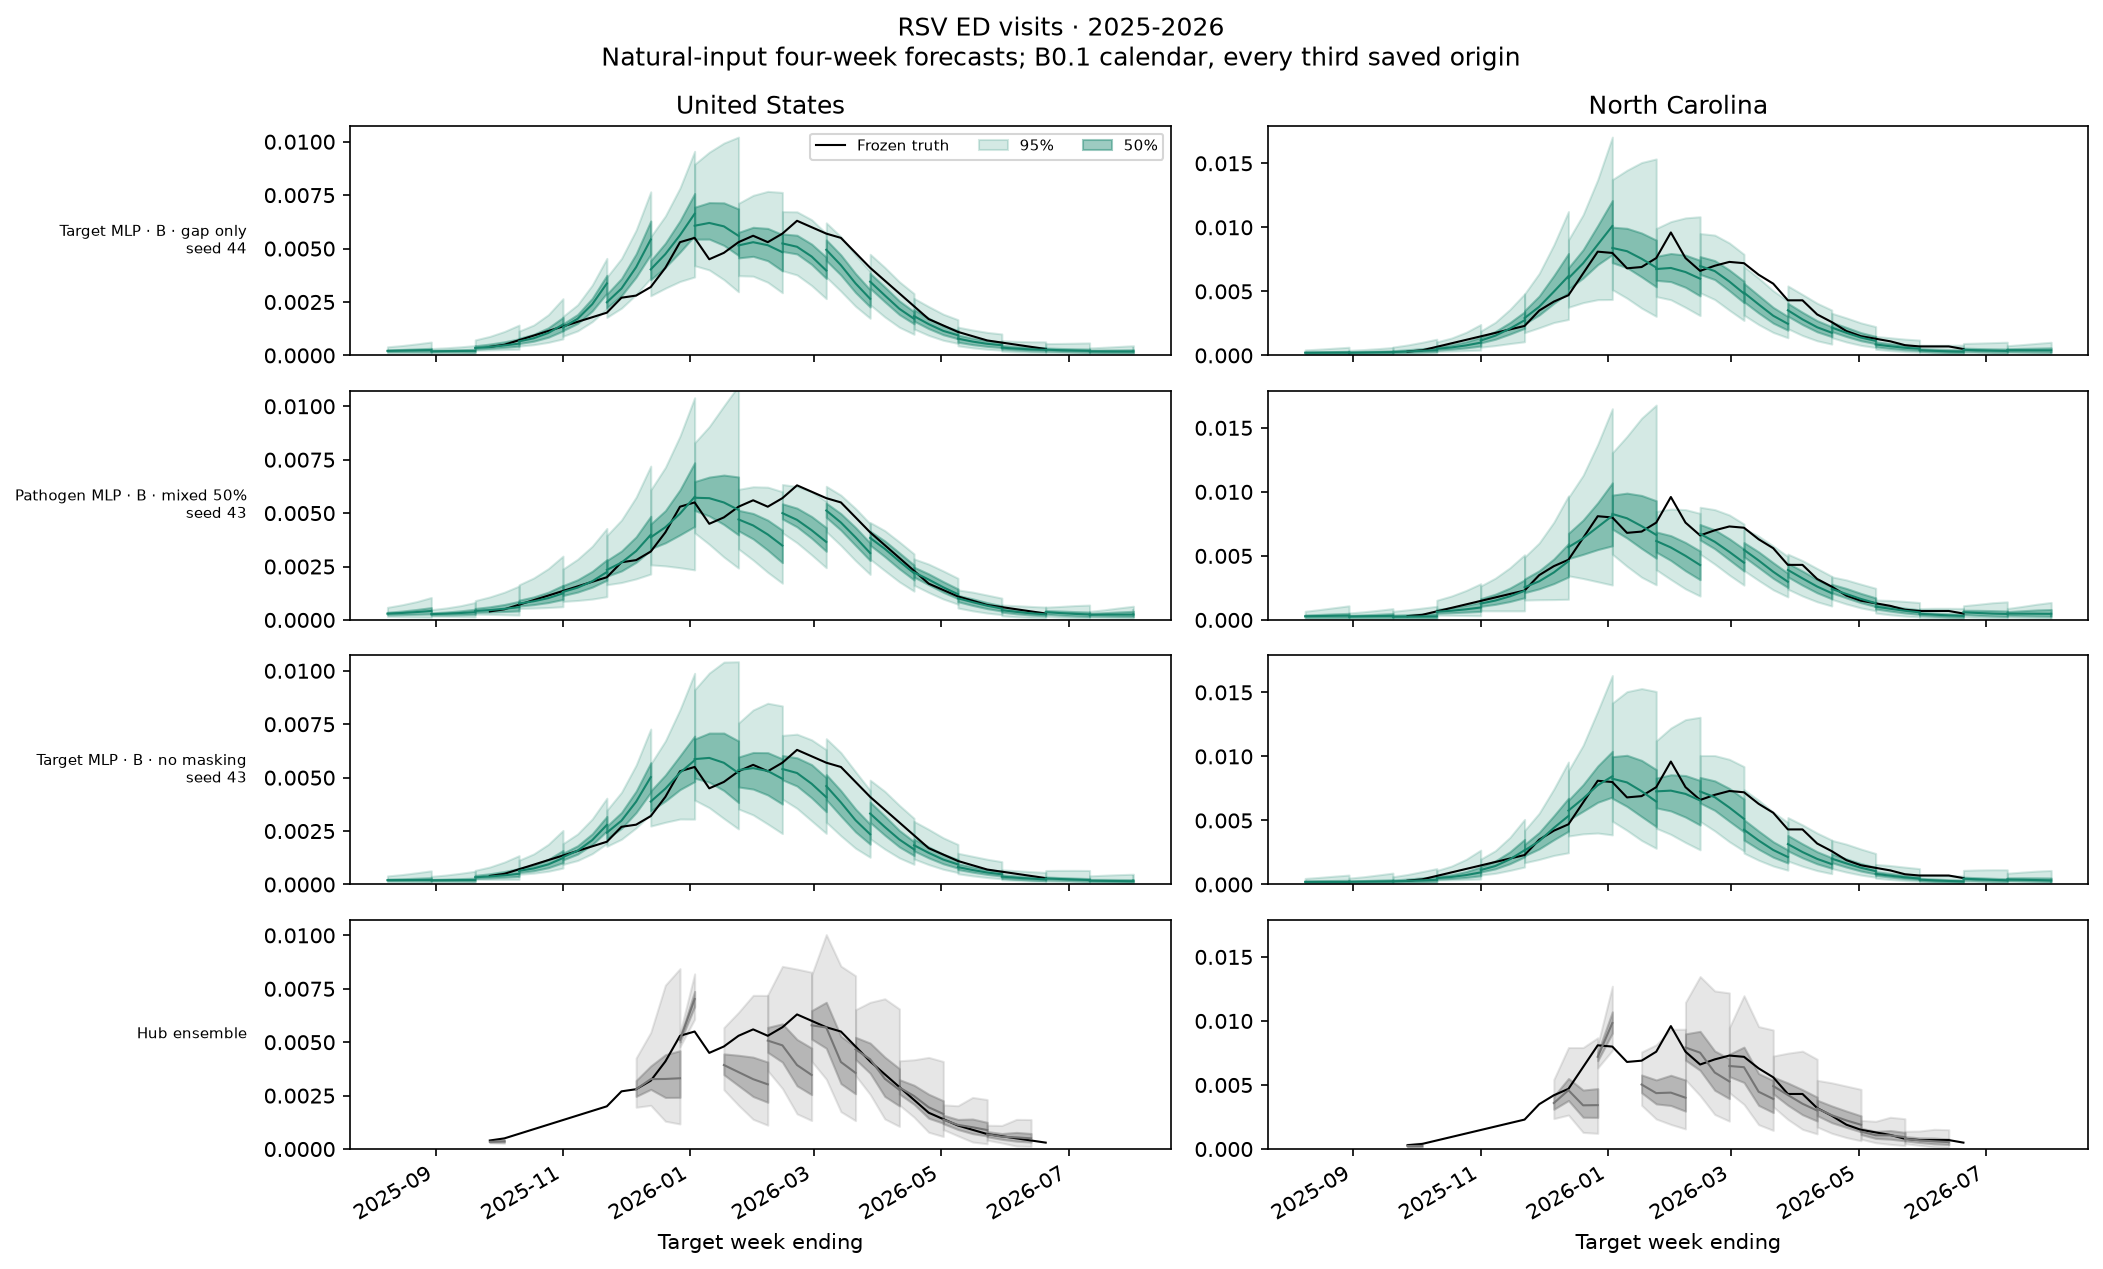
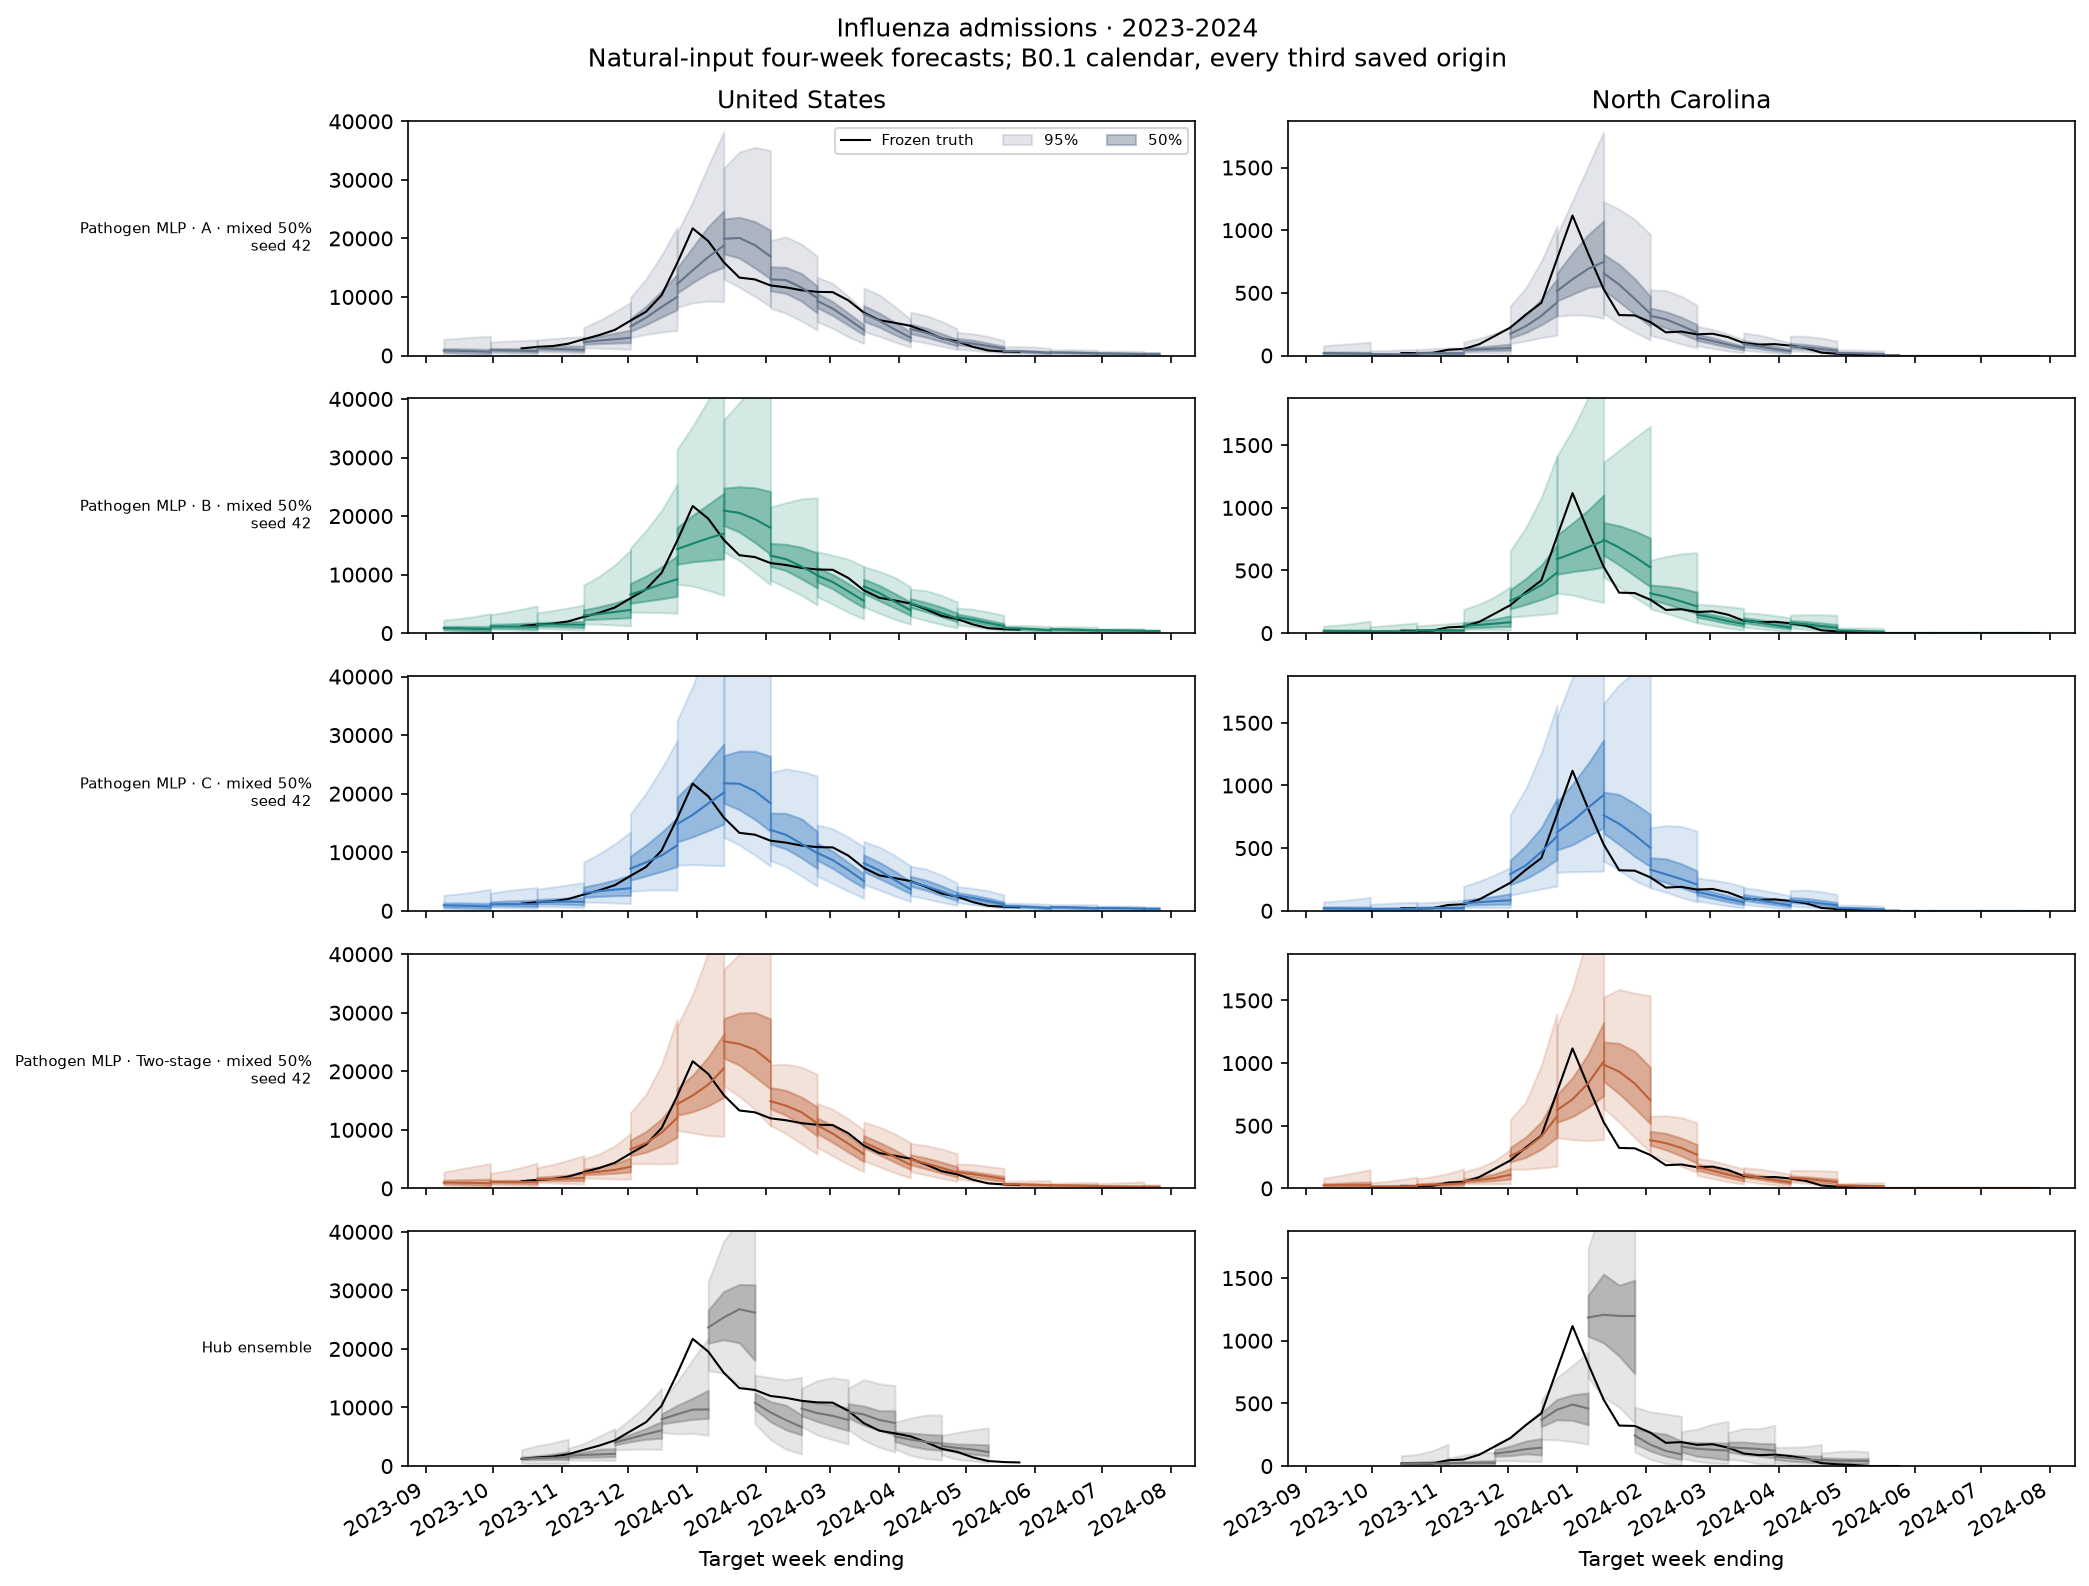
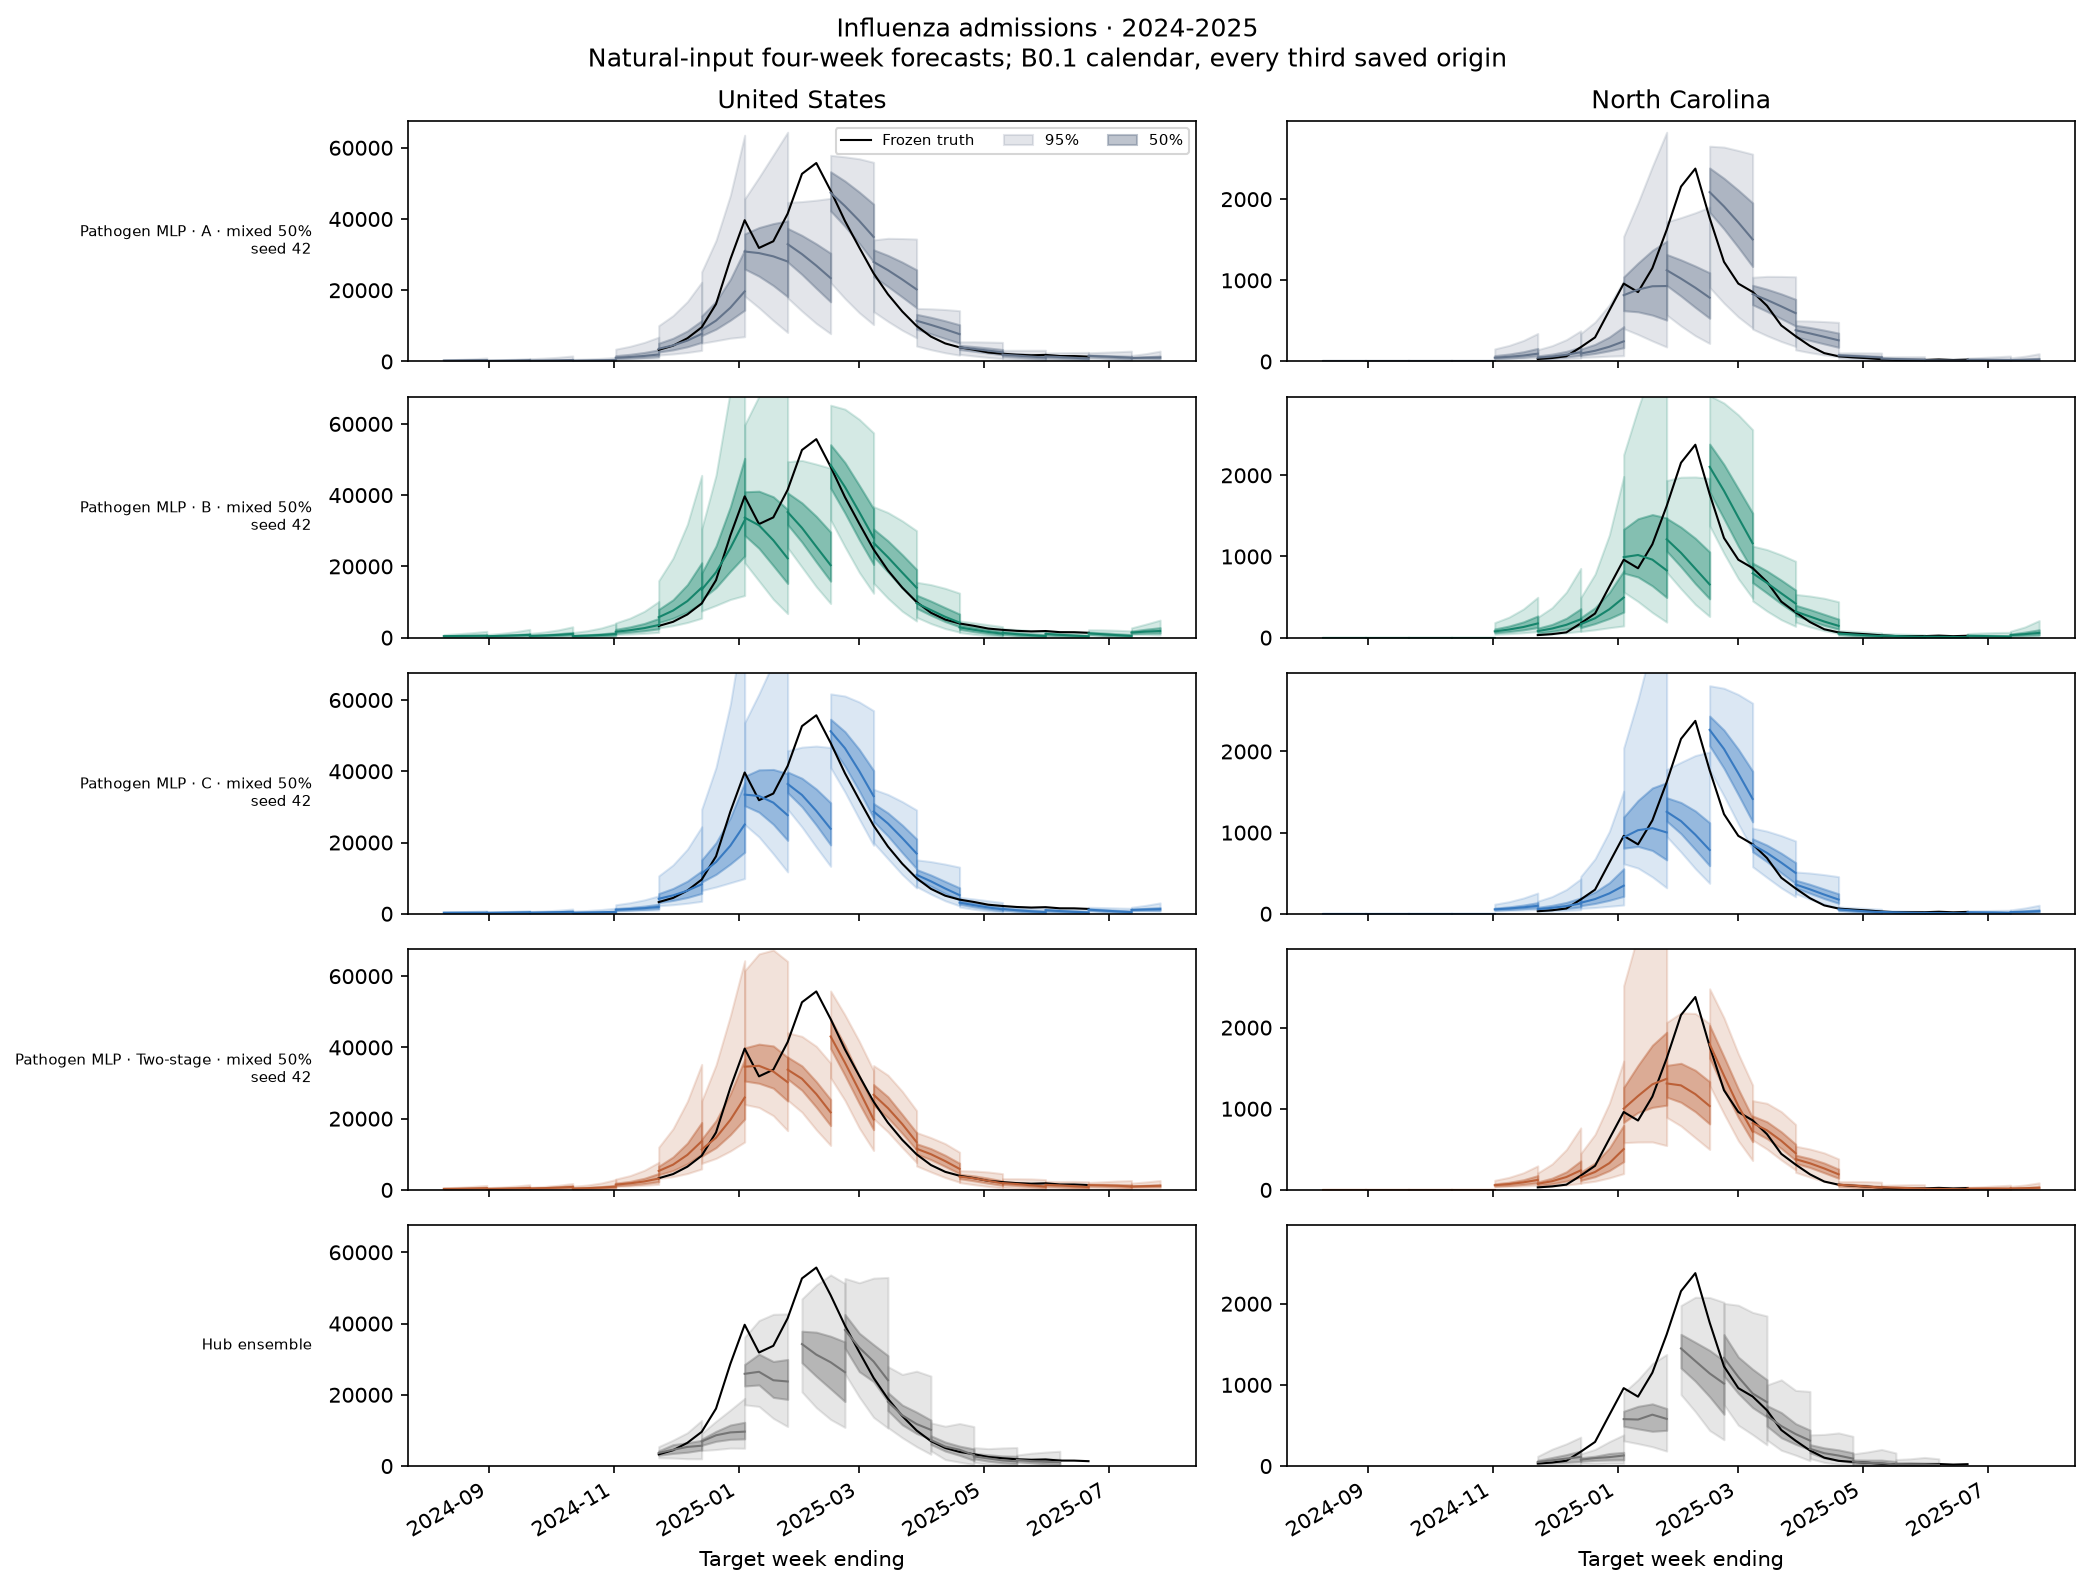
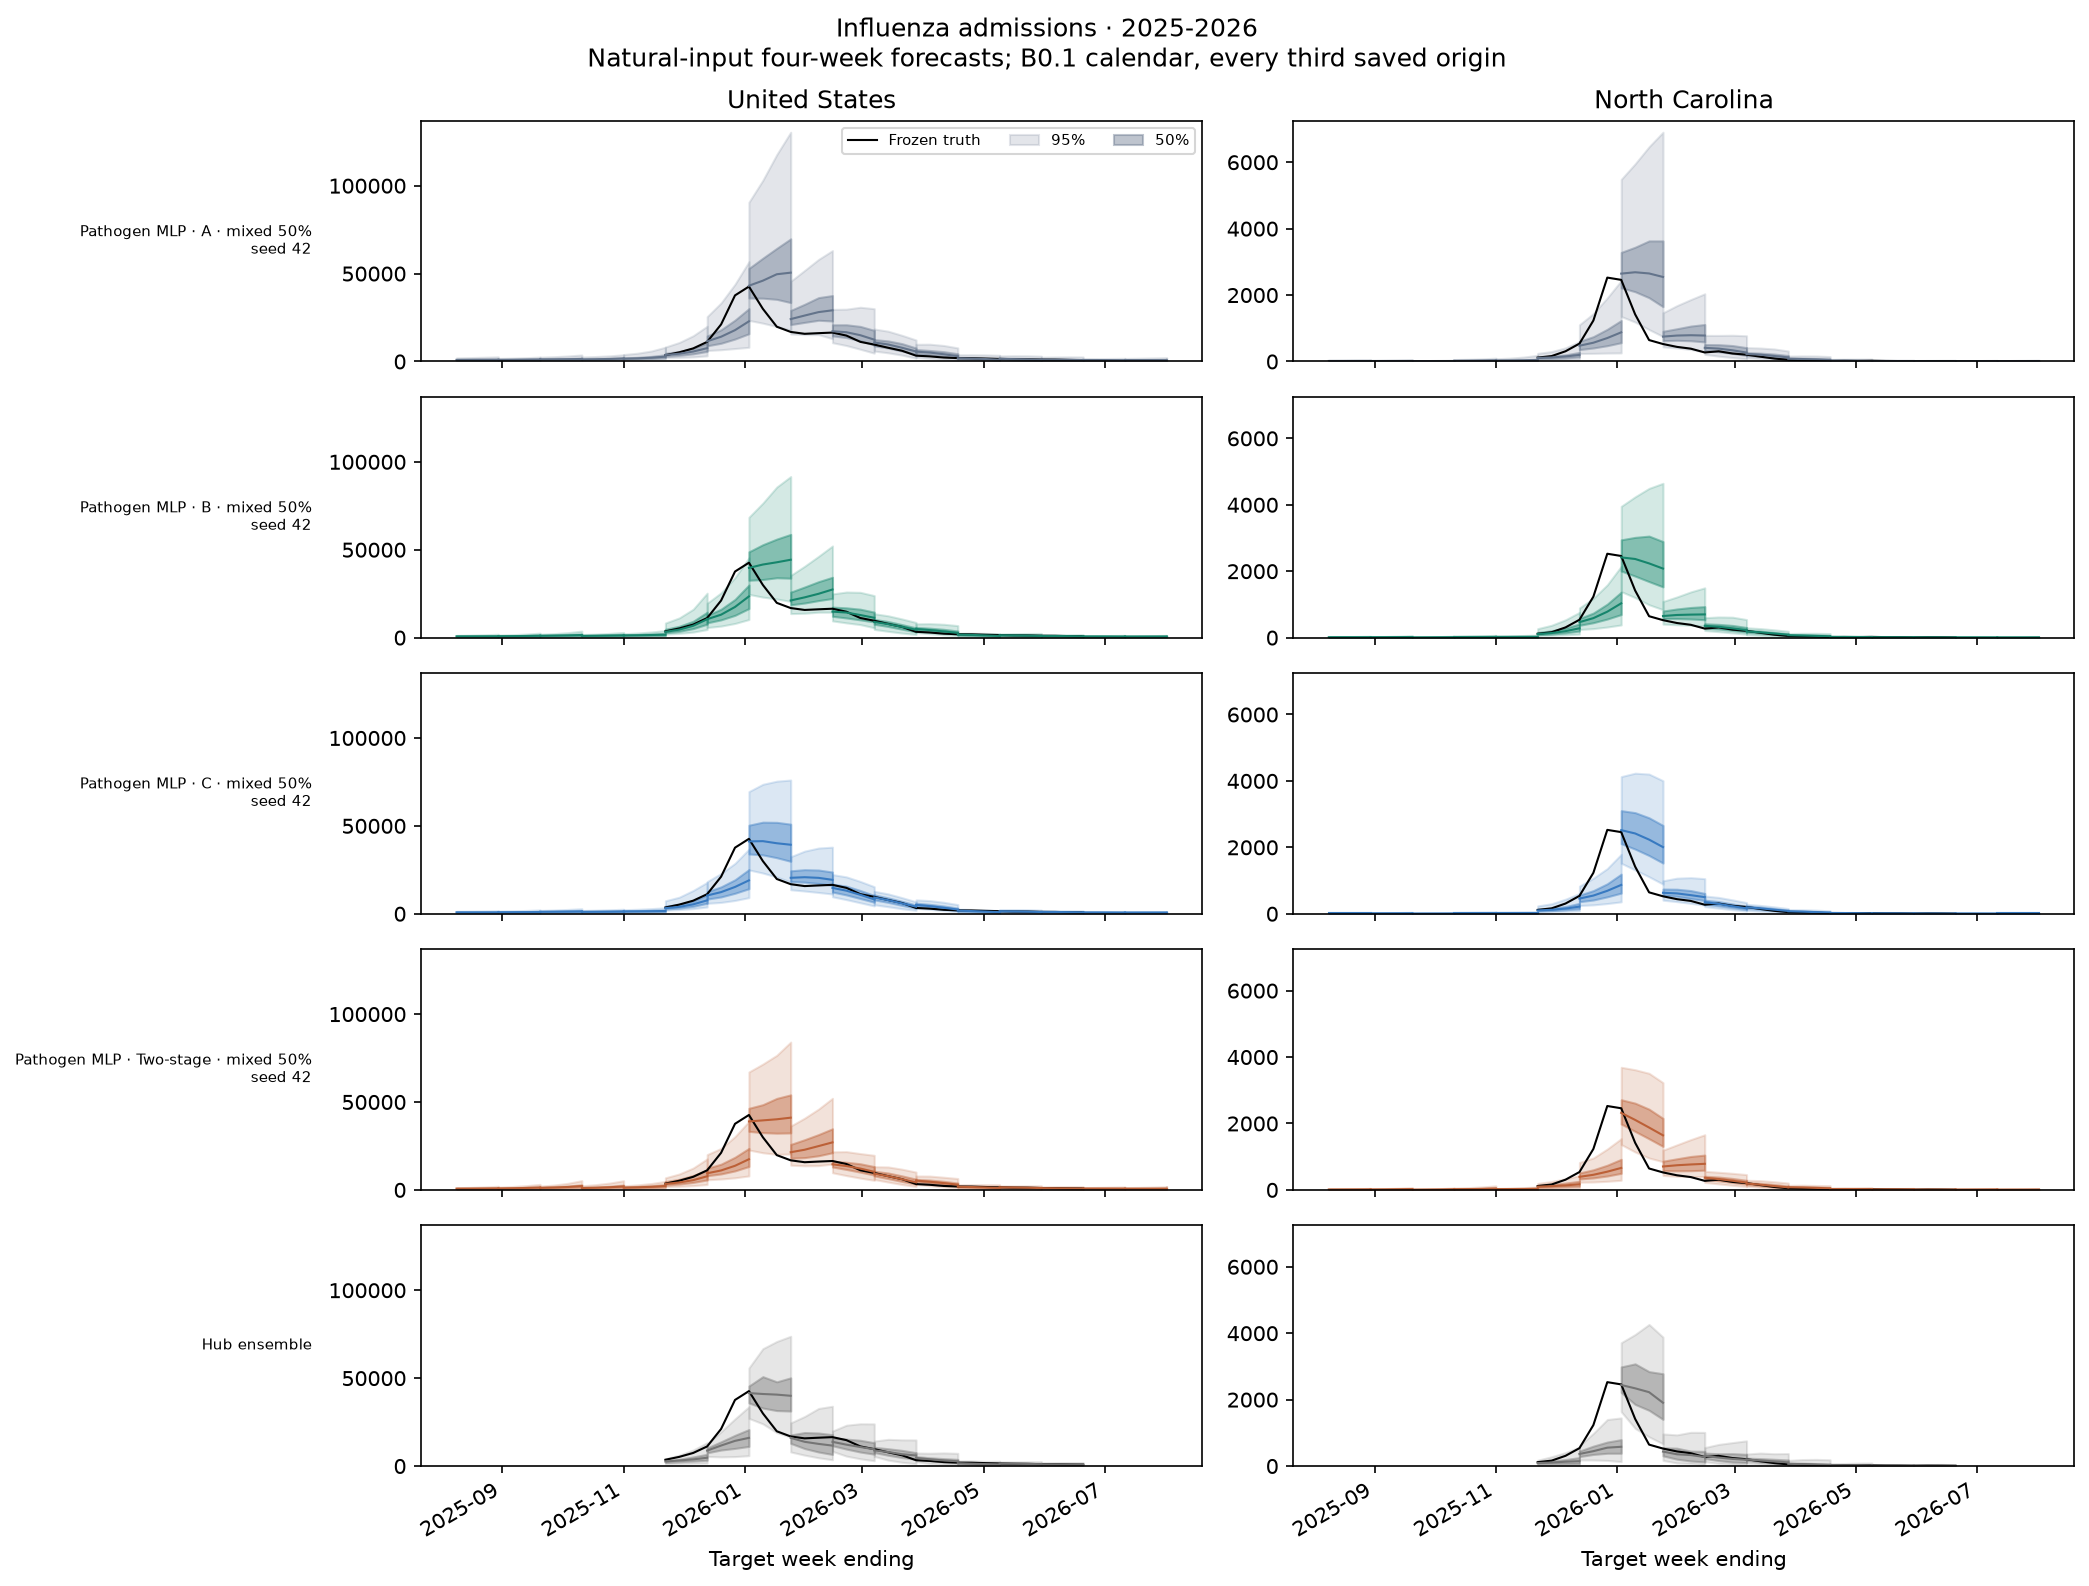
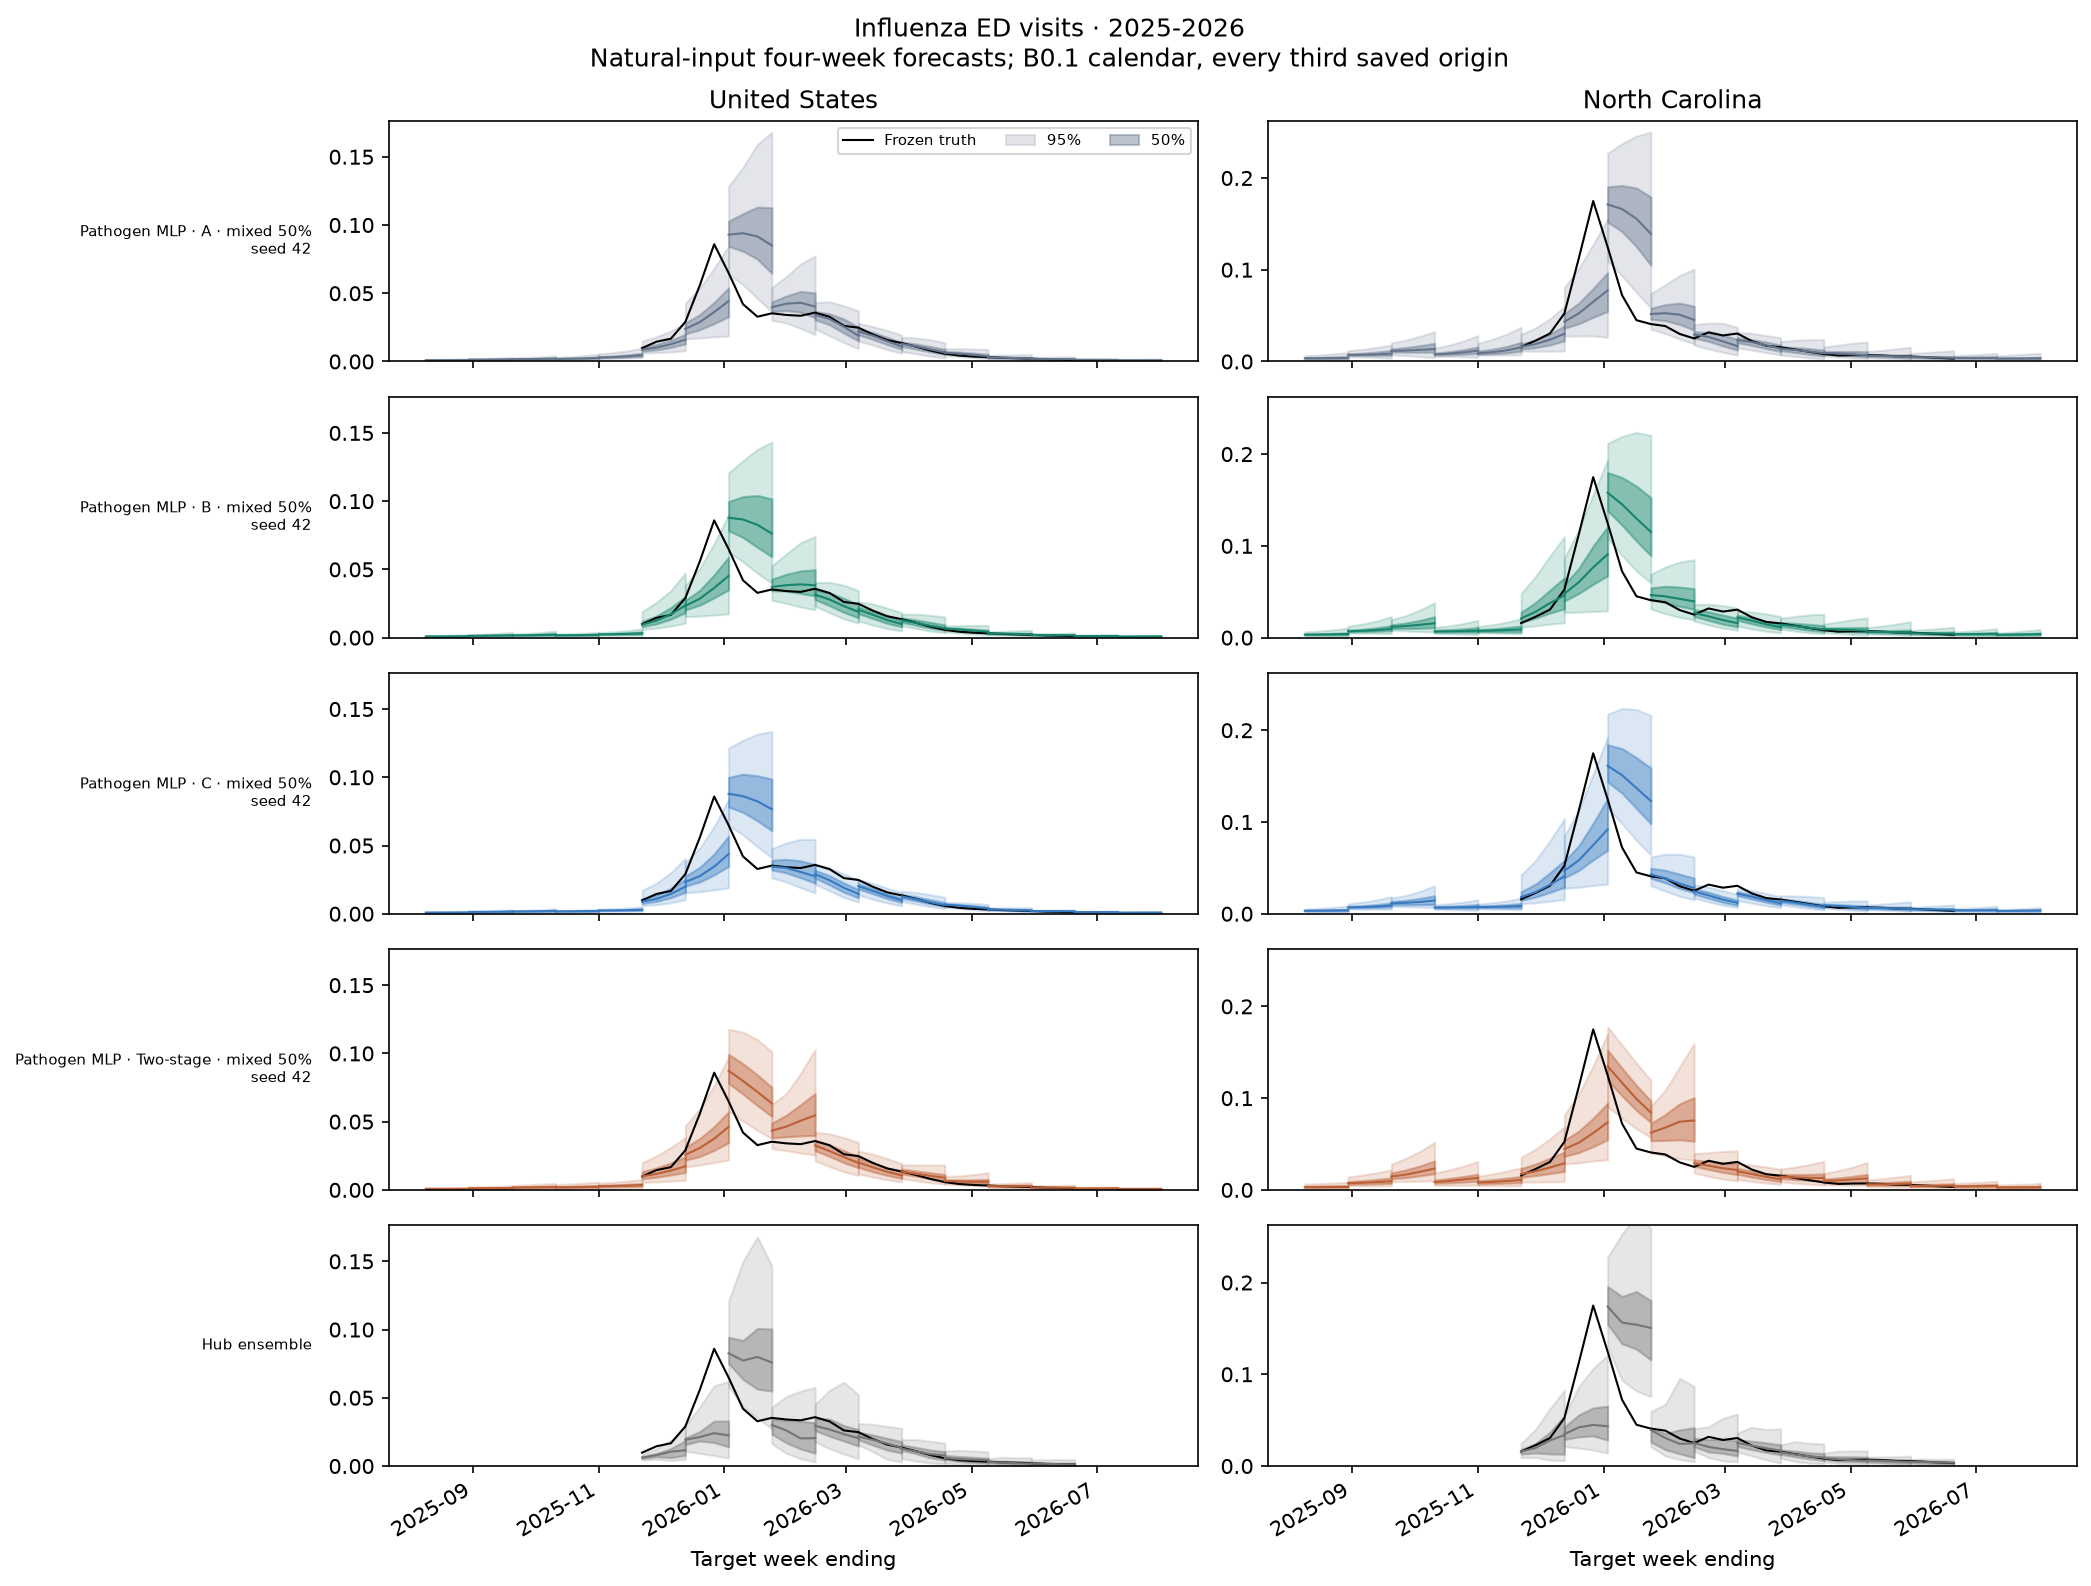
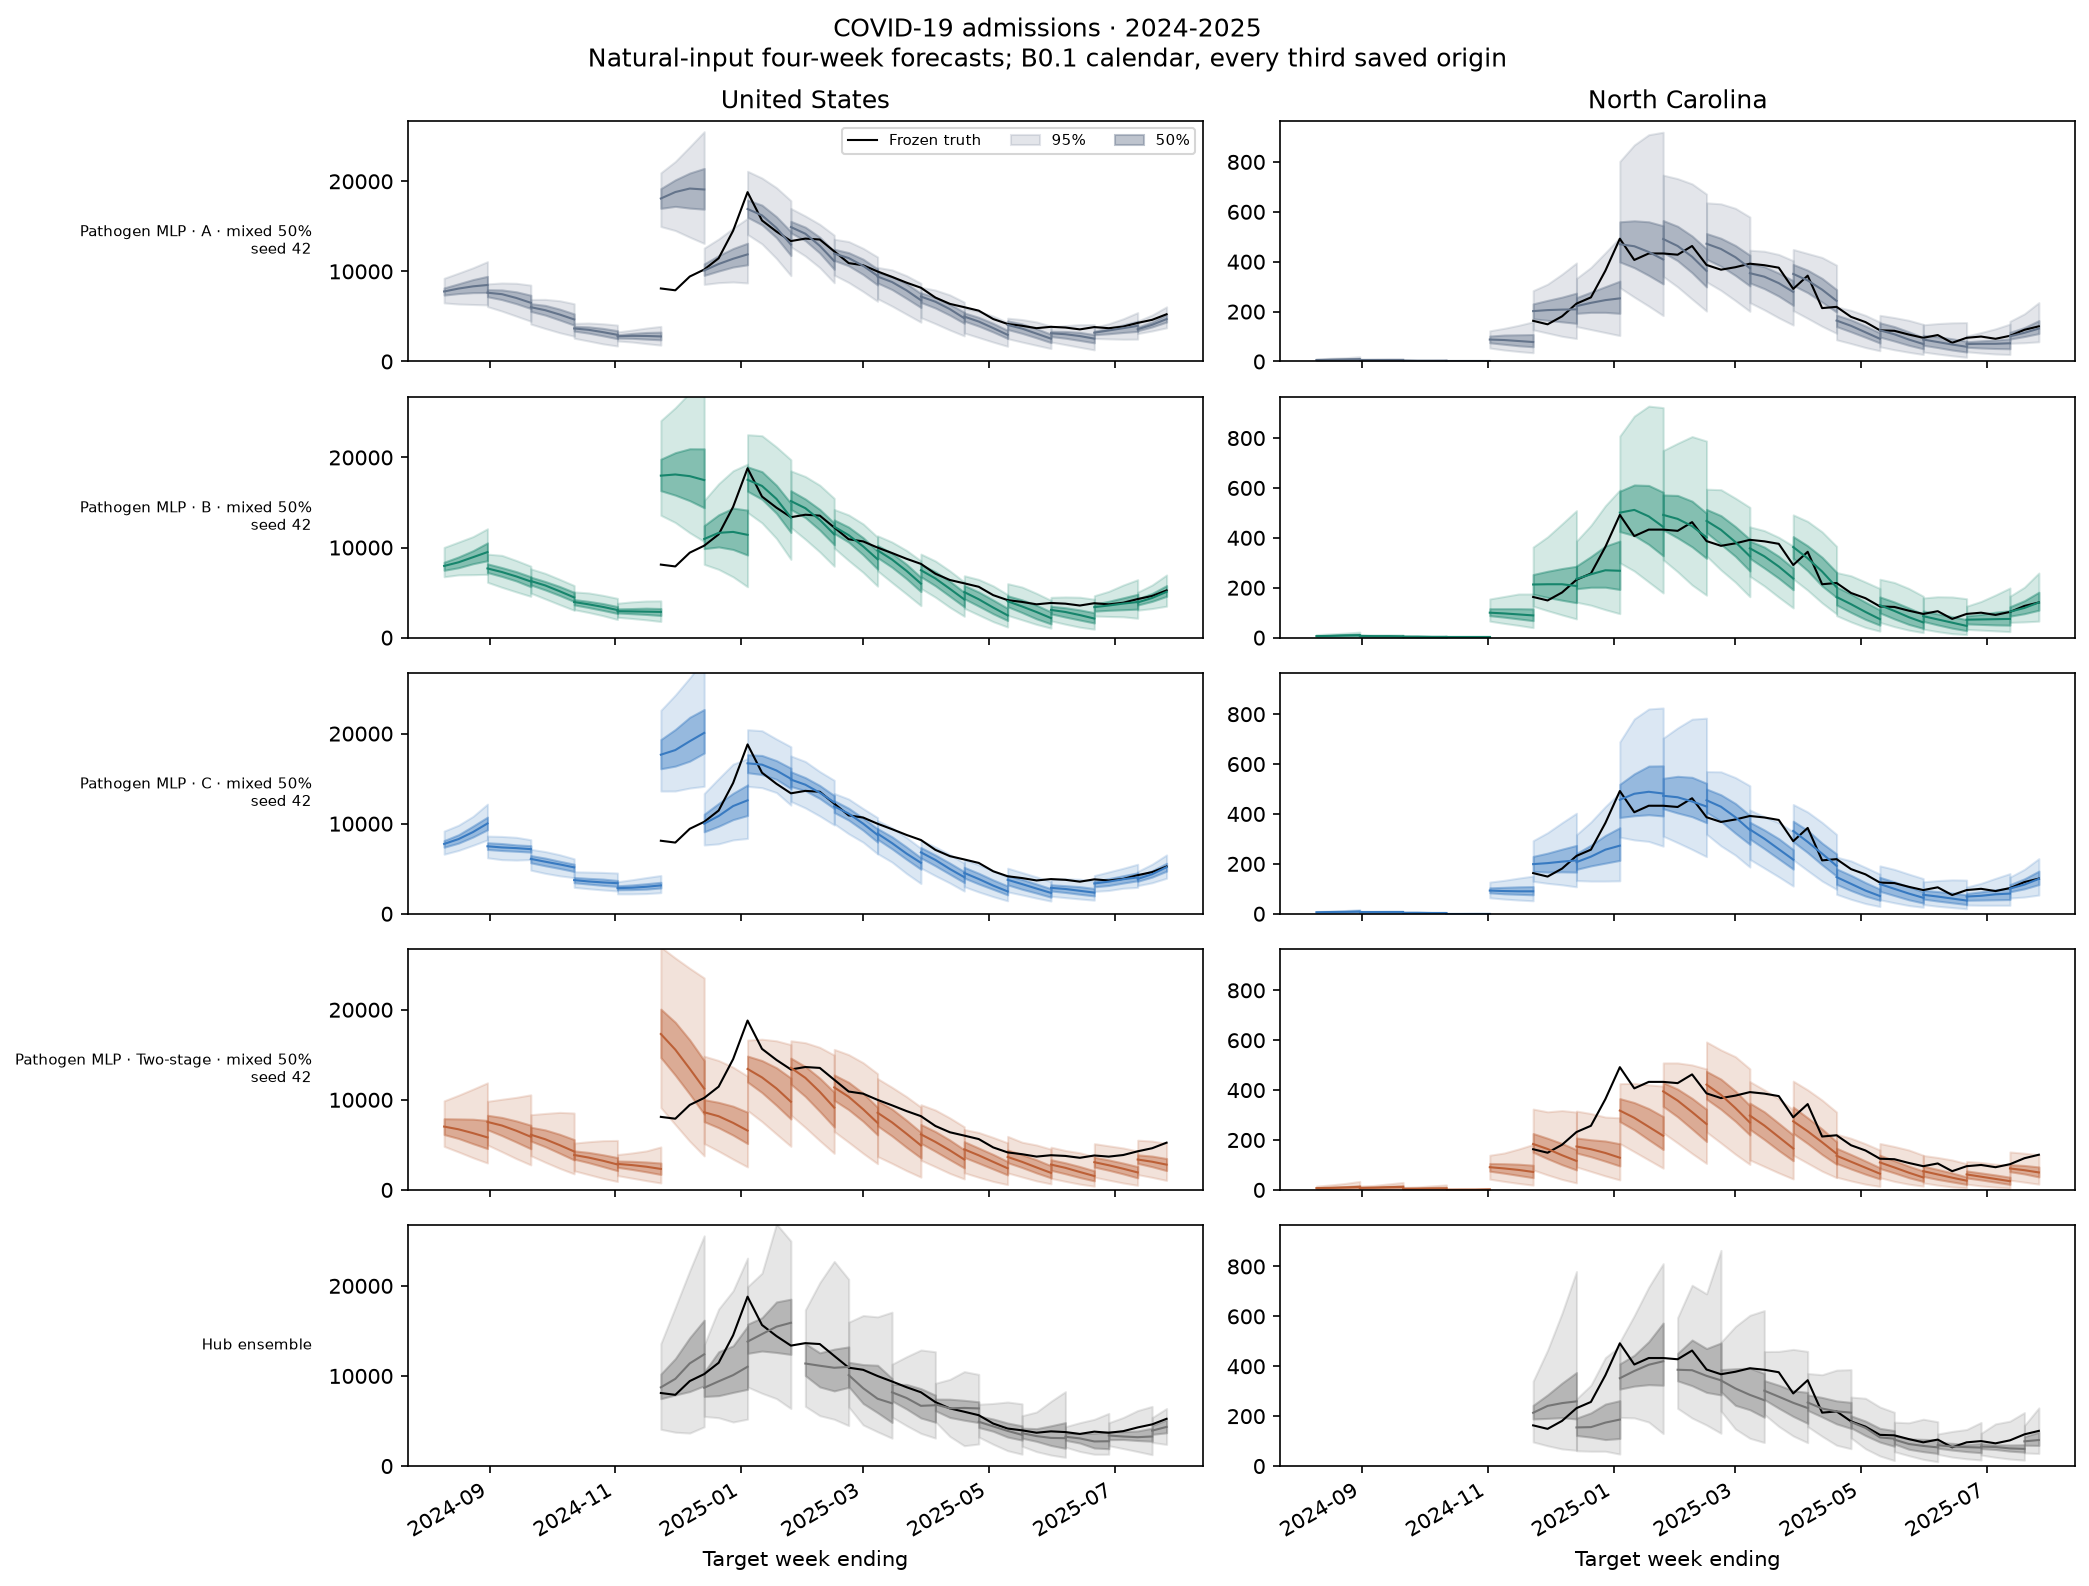
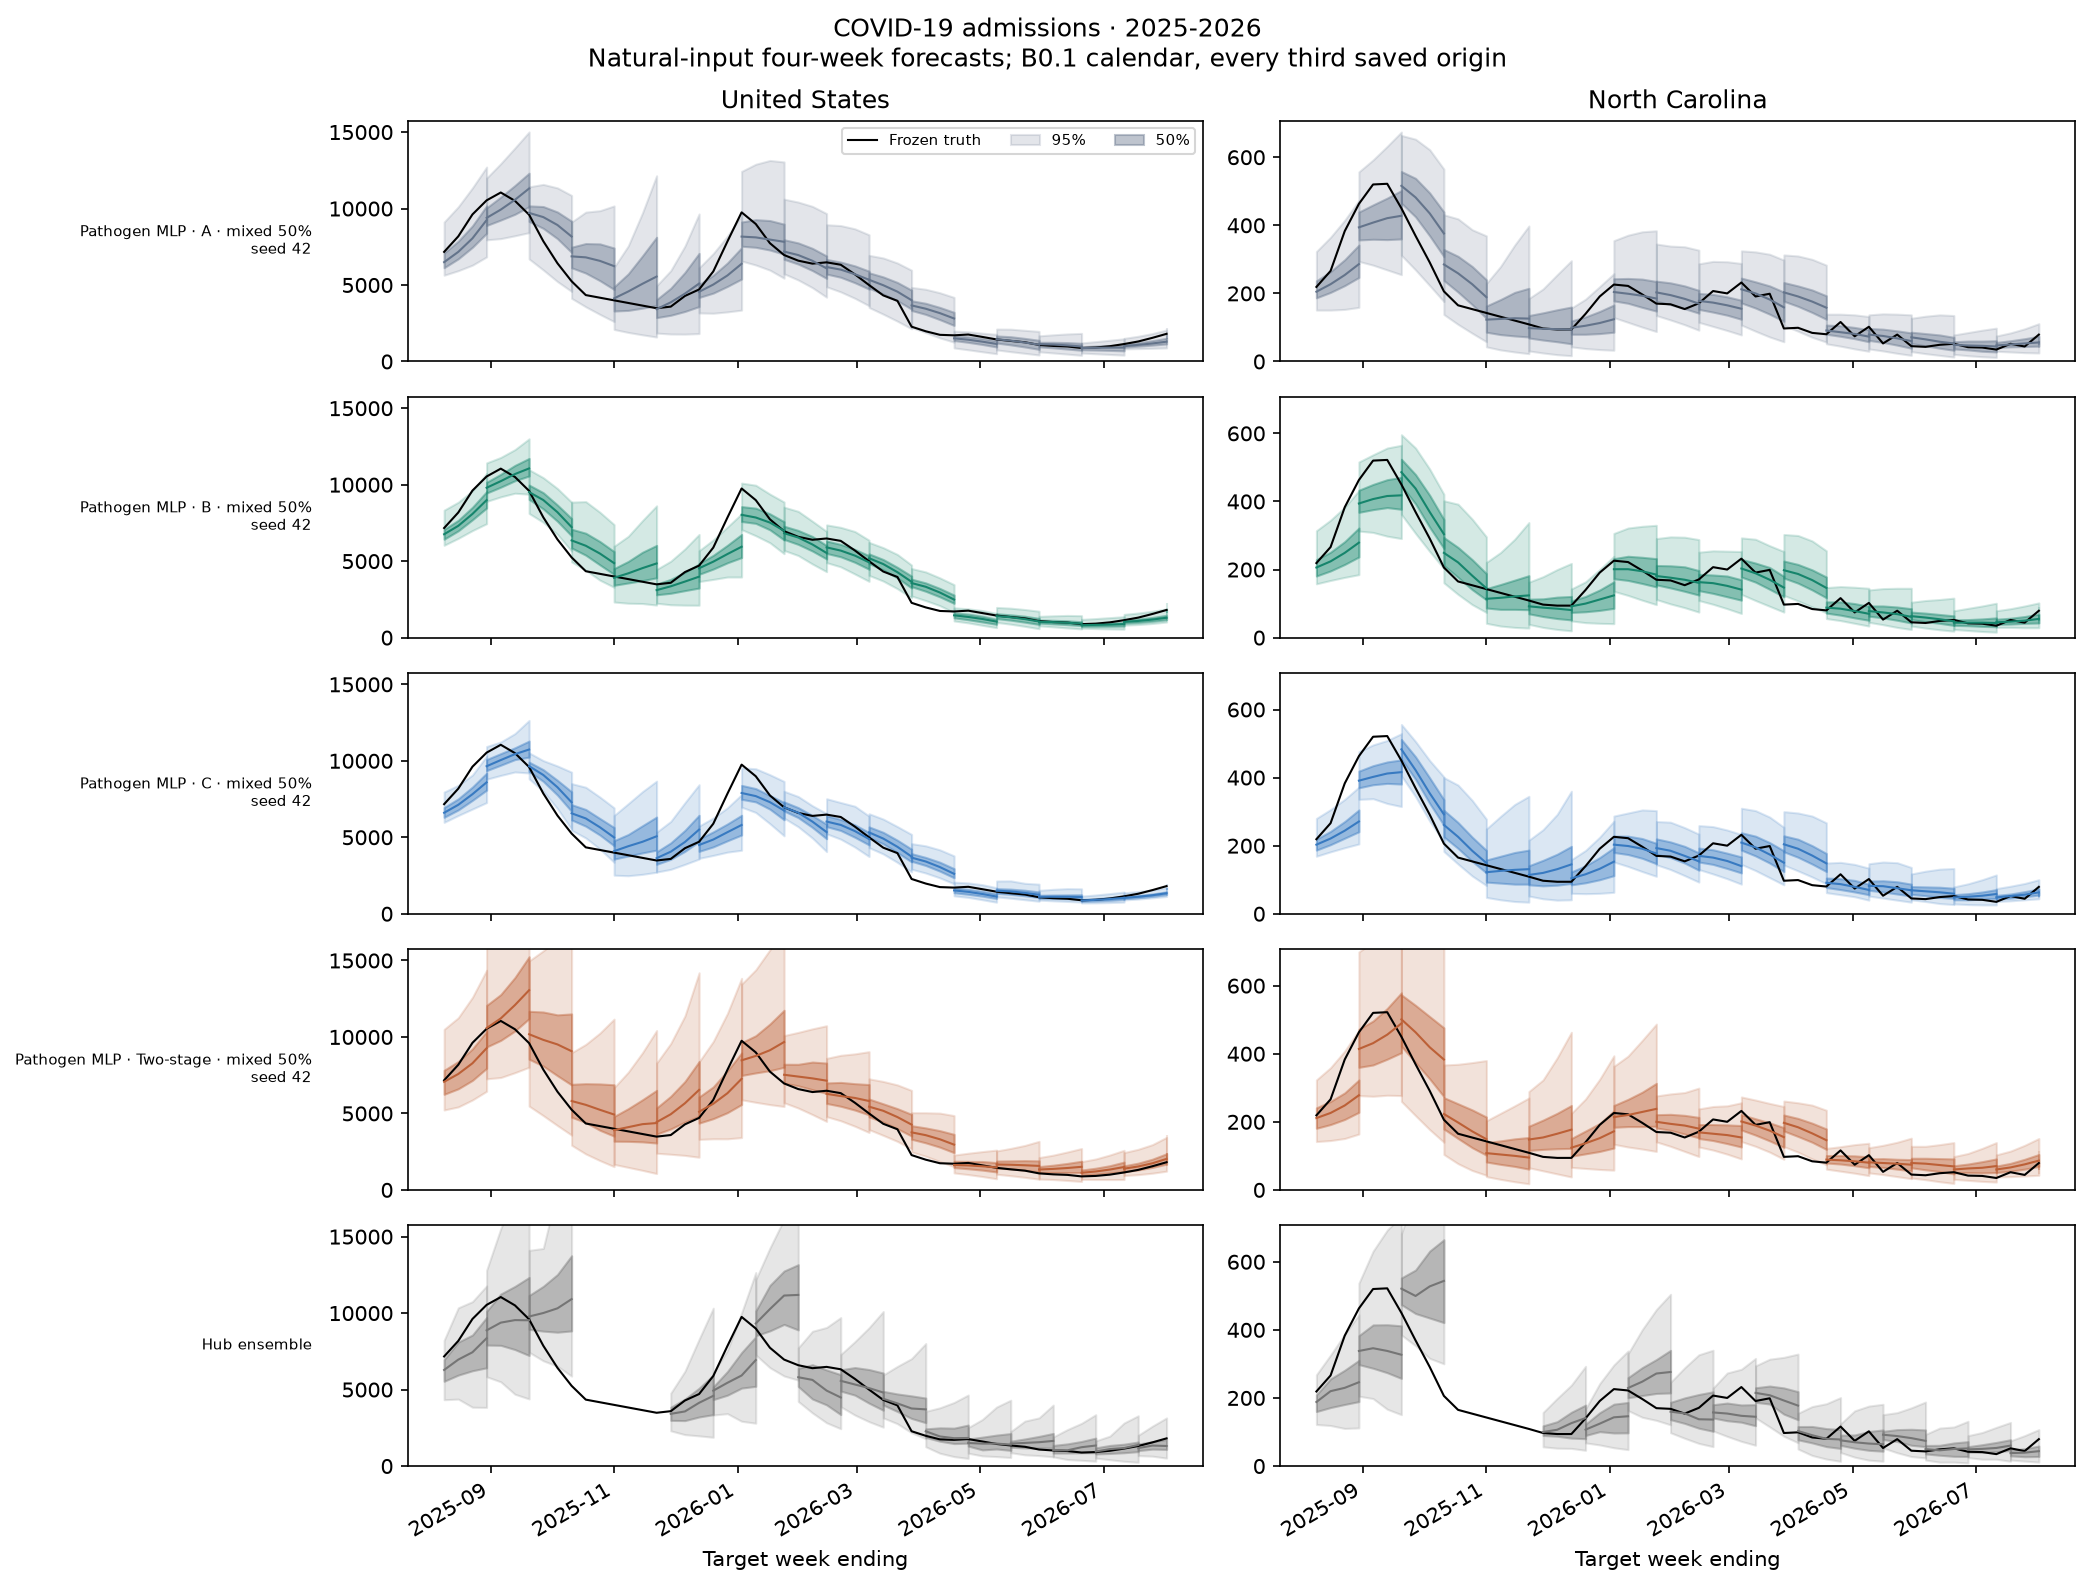
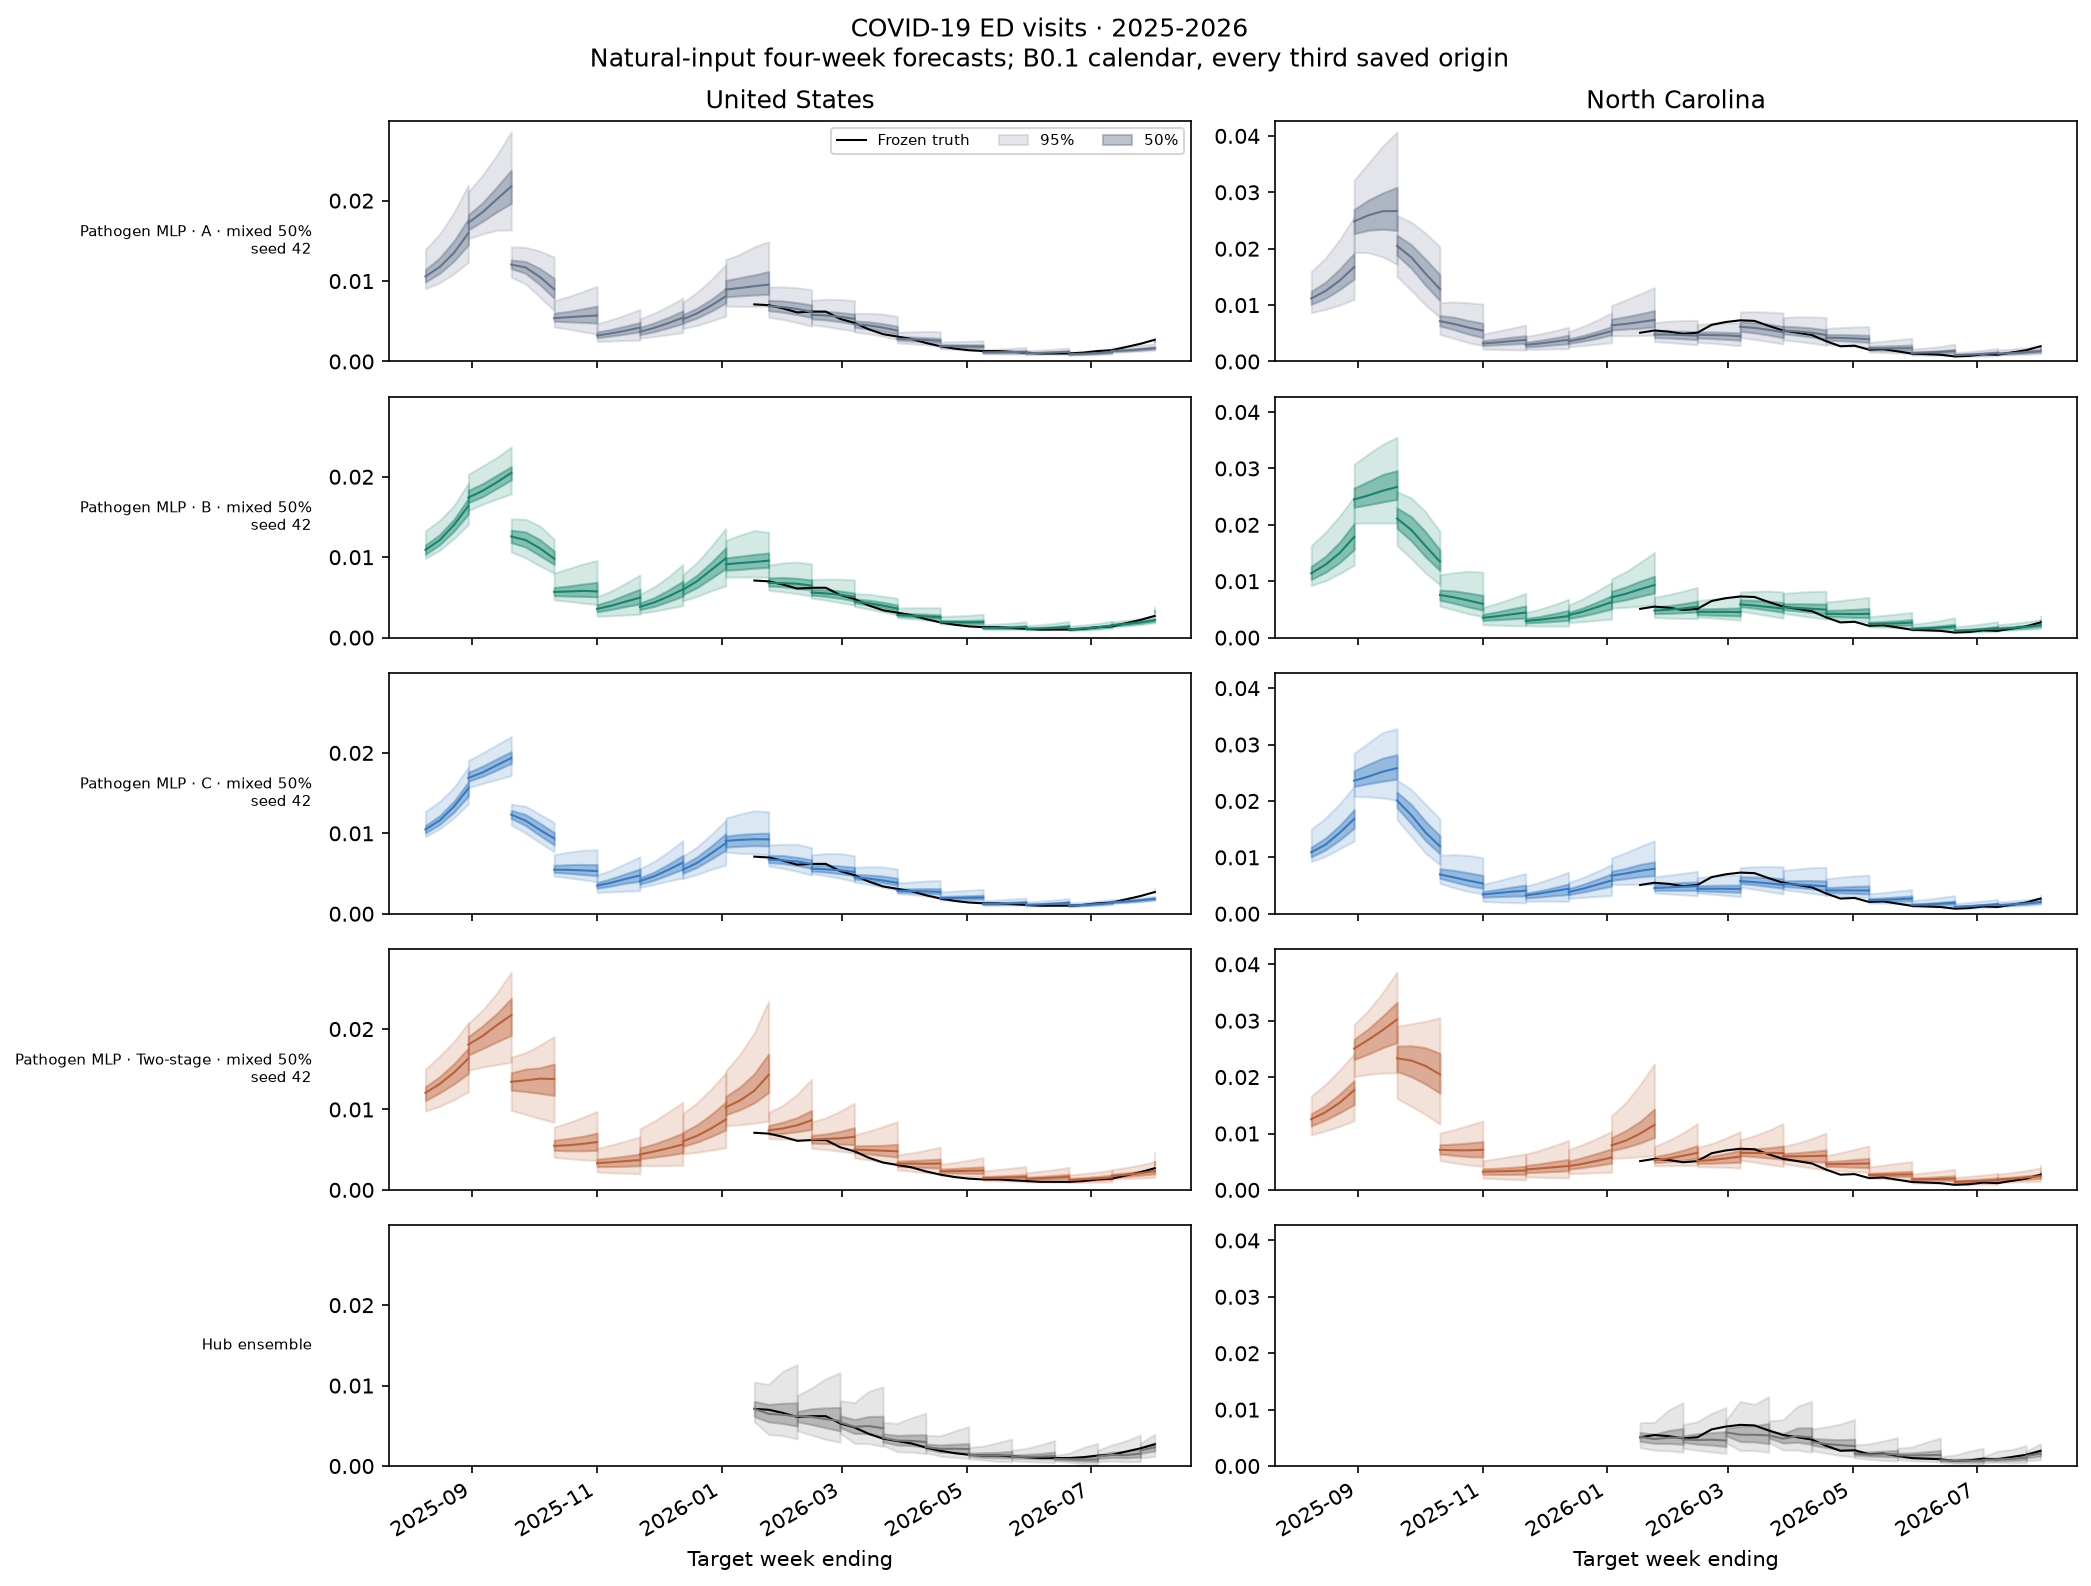
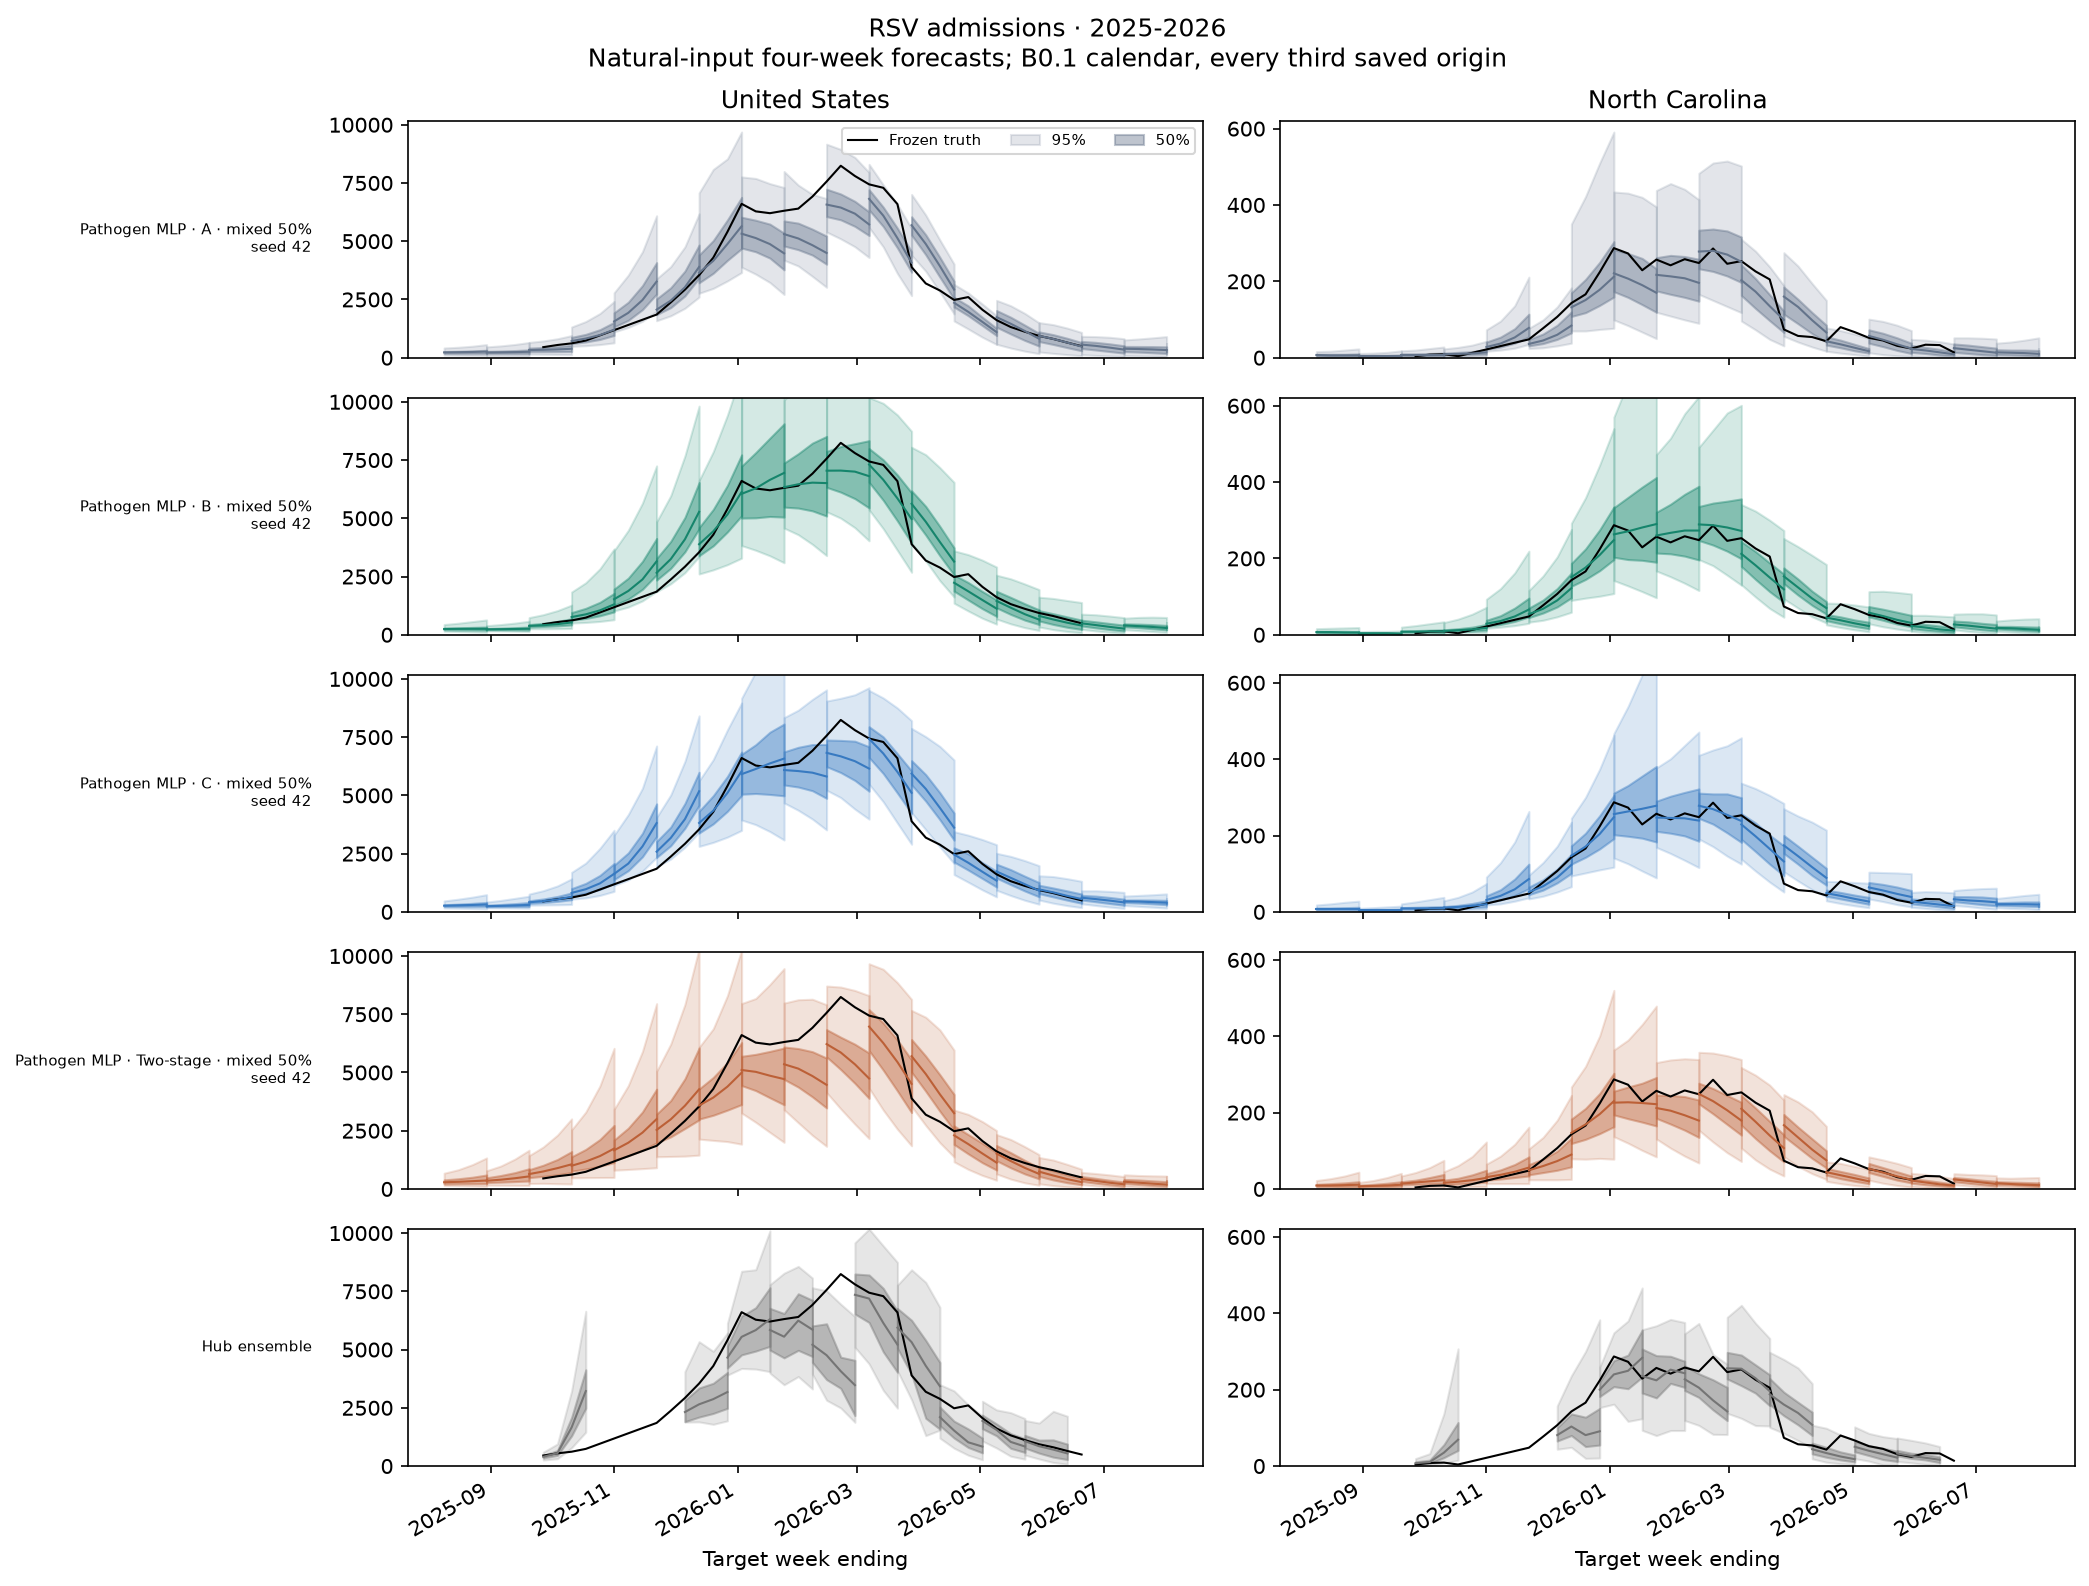
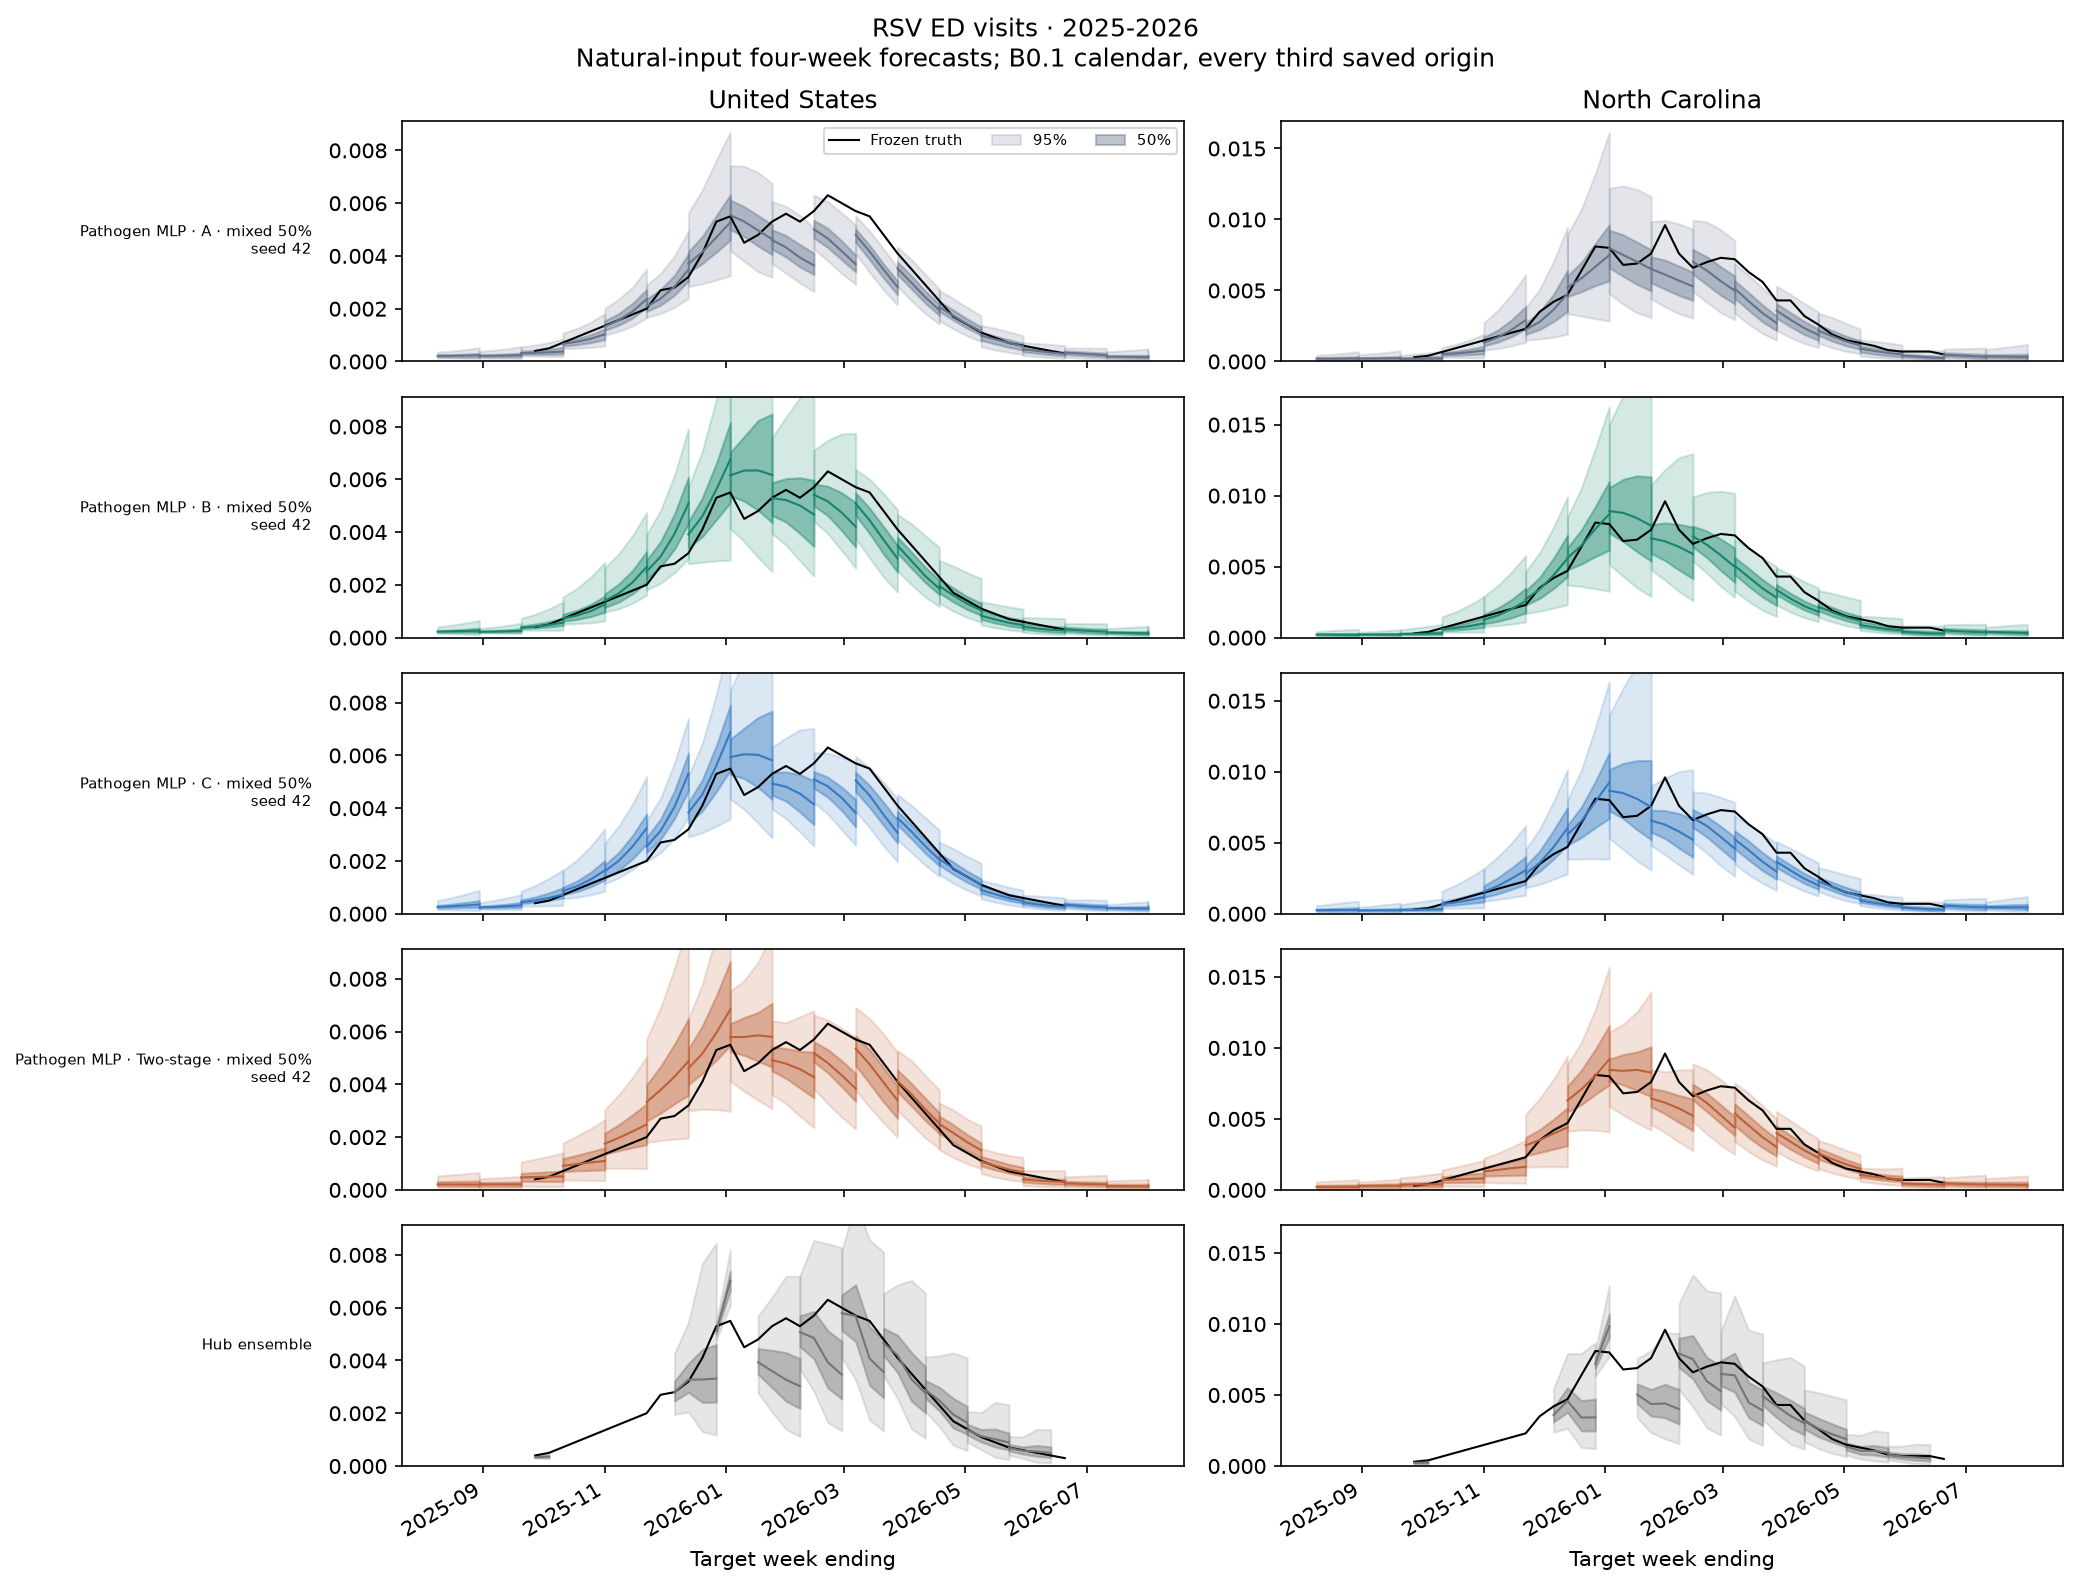
Natural-input four-week forecasts at every third saved origin, using the same full seasonal calendar and plotting rule as B0.1, for the United States and North Carolina. Black is frozen truth; colored bands are 50% and 95% intervals, with median lines. Y scales match across models within each location. These examples illustrate forecasts and do not replace the all-location scoring. Forecasts extend beyond the scored Hub window; truth and ensemble remain limited to their available frozen dates. No missing forecast or truth value is filled in. The ranking still uses only identical frozen Hub support. Each row samples its own available origins, as in B0.1.
The standard order throughout the target/season panels is influenza → COVID-19 → RSV, then admissions → ED visits, then oldest → newest season. Saved model dates span September 9, 2023–July 27, 2024; August 10, 2024–July 26, 2025; and August 9, 2025–August 1, 2026, respectively. The final fan can have fewer than four available horizons at the held-out season boundary.
Leading configurations
The top three configurations with all three seeds complete, each at its median-scoring seed: Target MLP · B · gap only — seed 44; Pathogen MLP · B · mixed 50% — seed 43; Target MLP · B · no masking — seed 43.
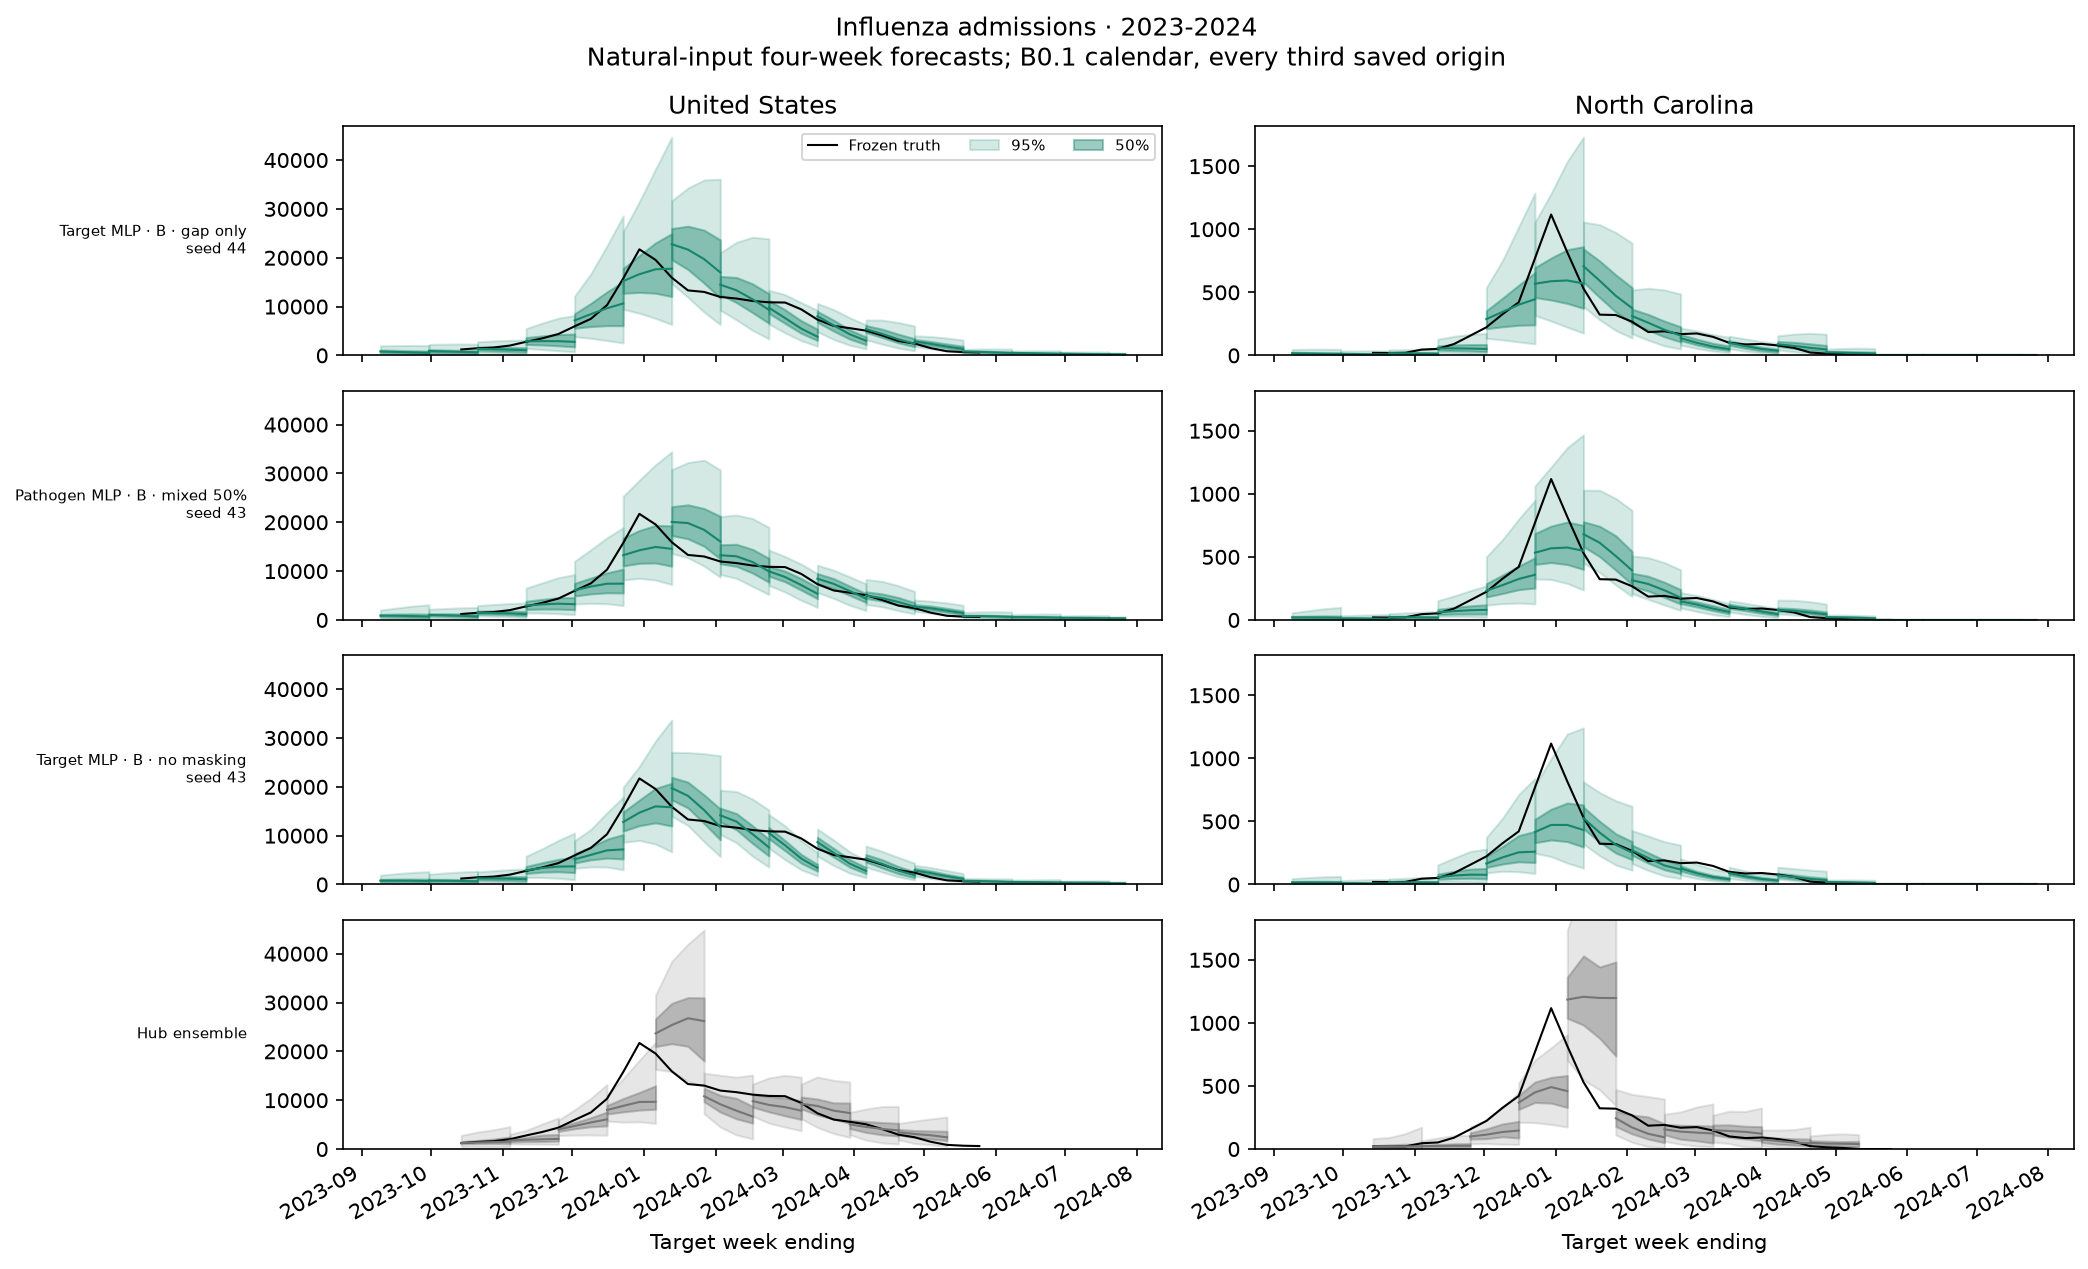
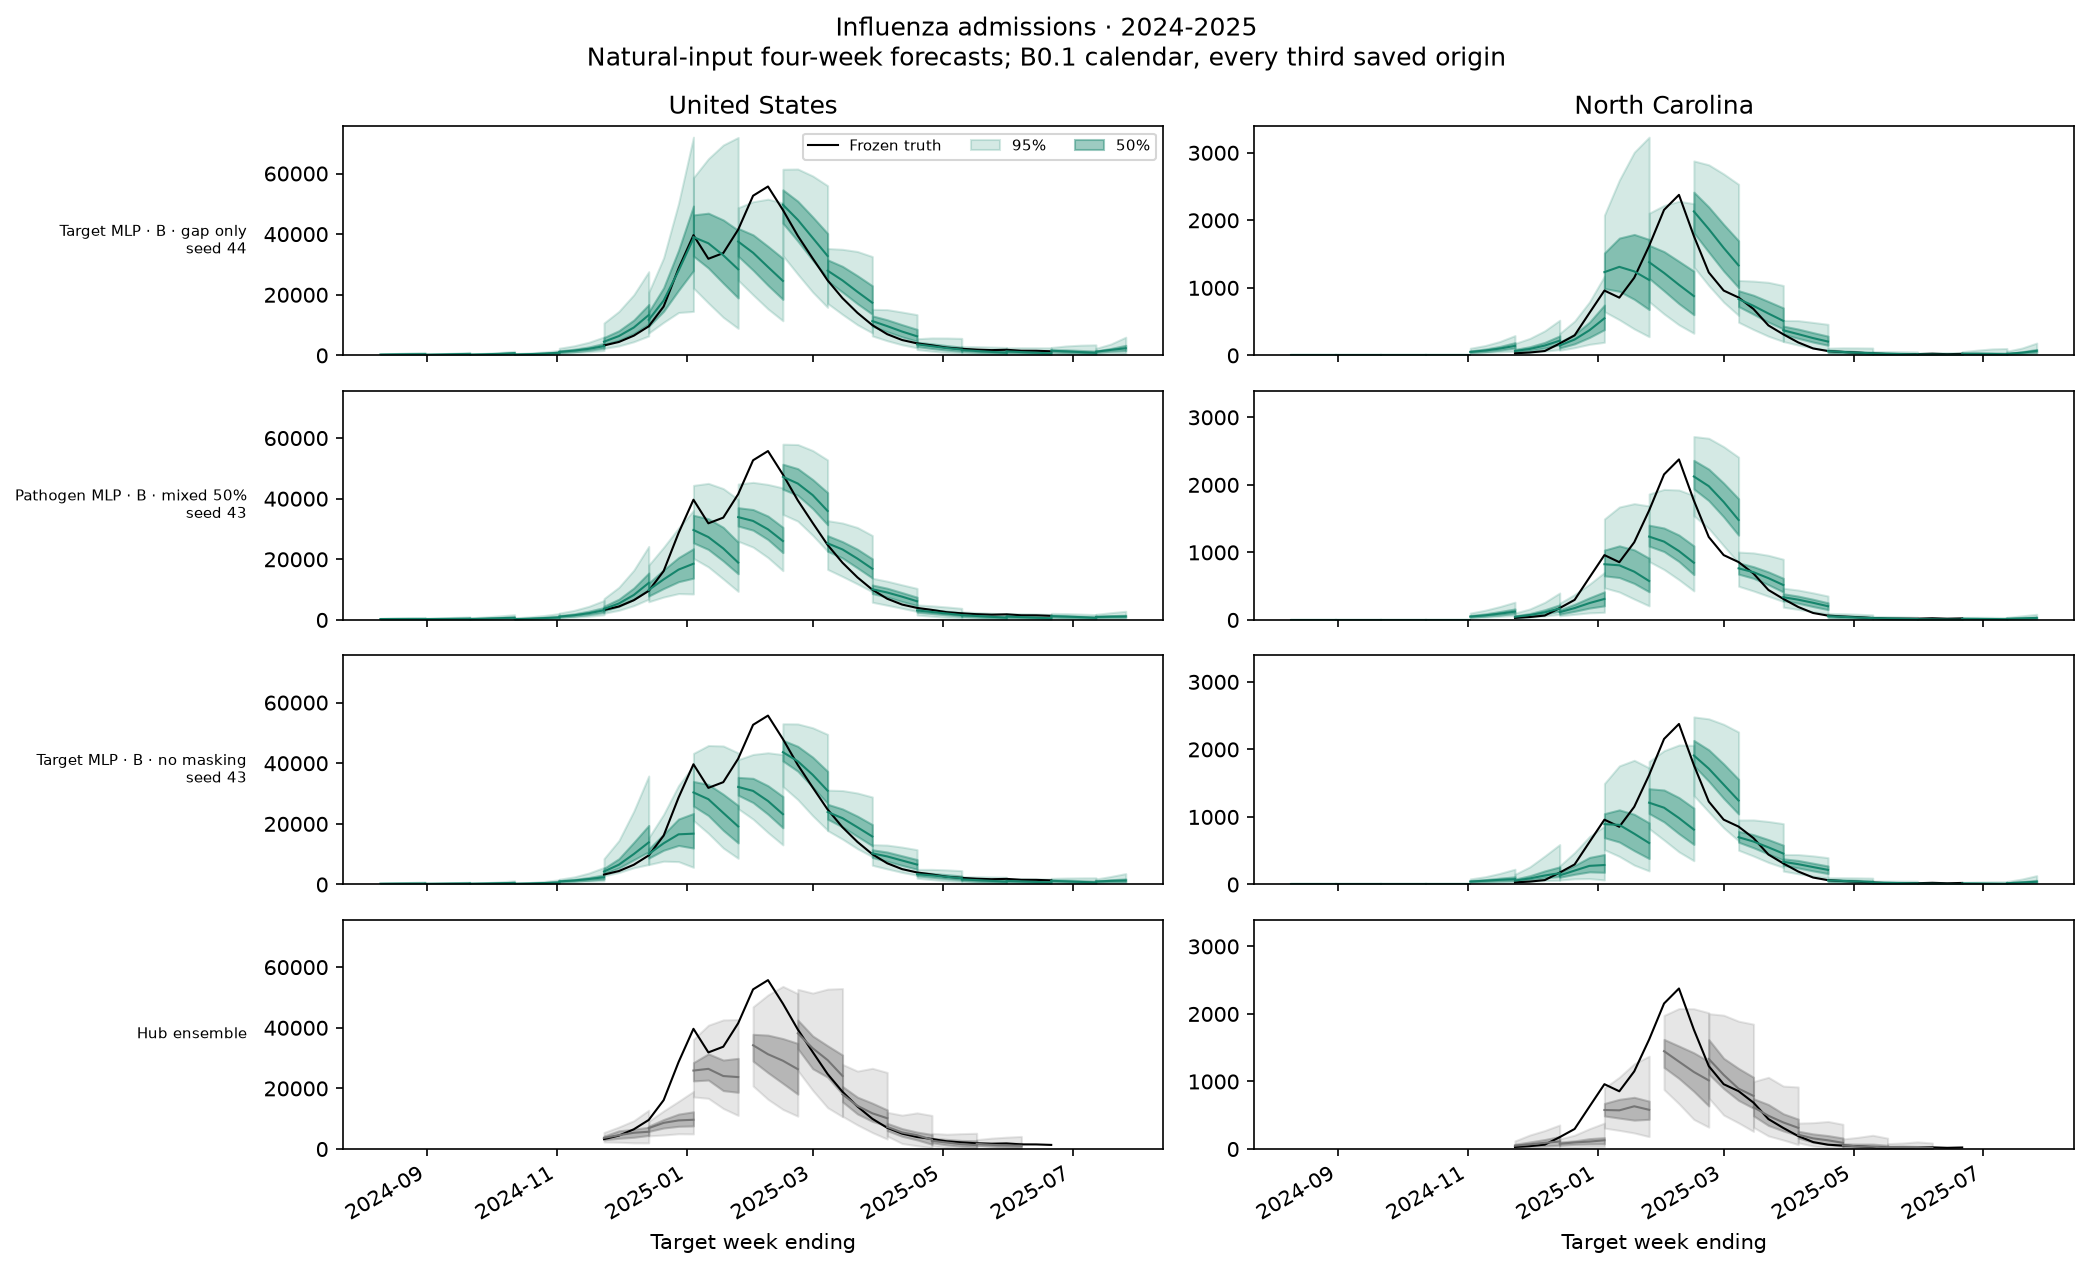
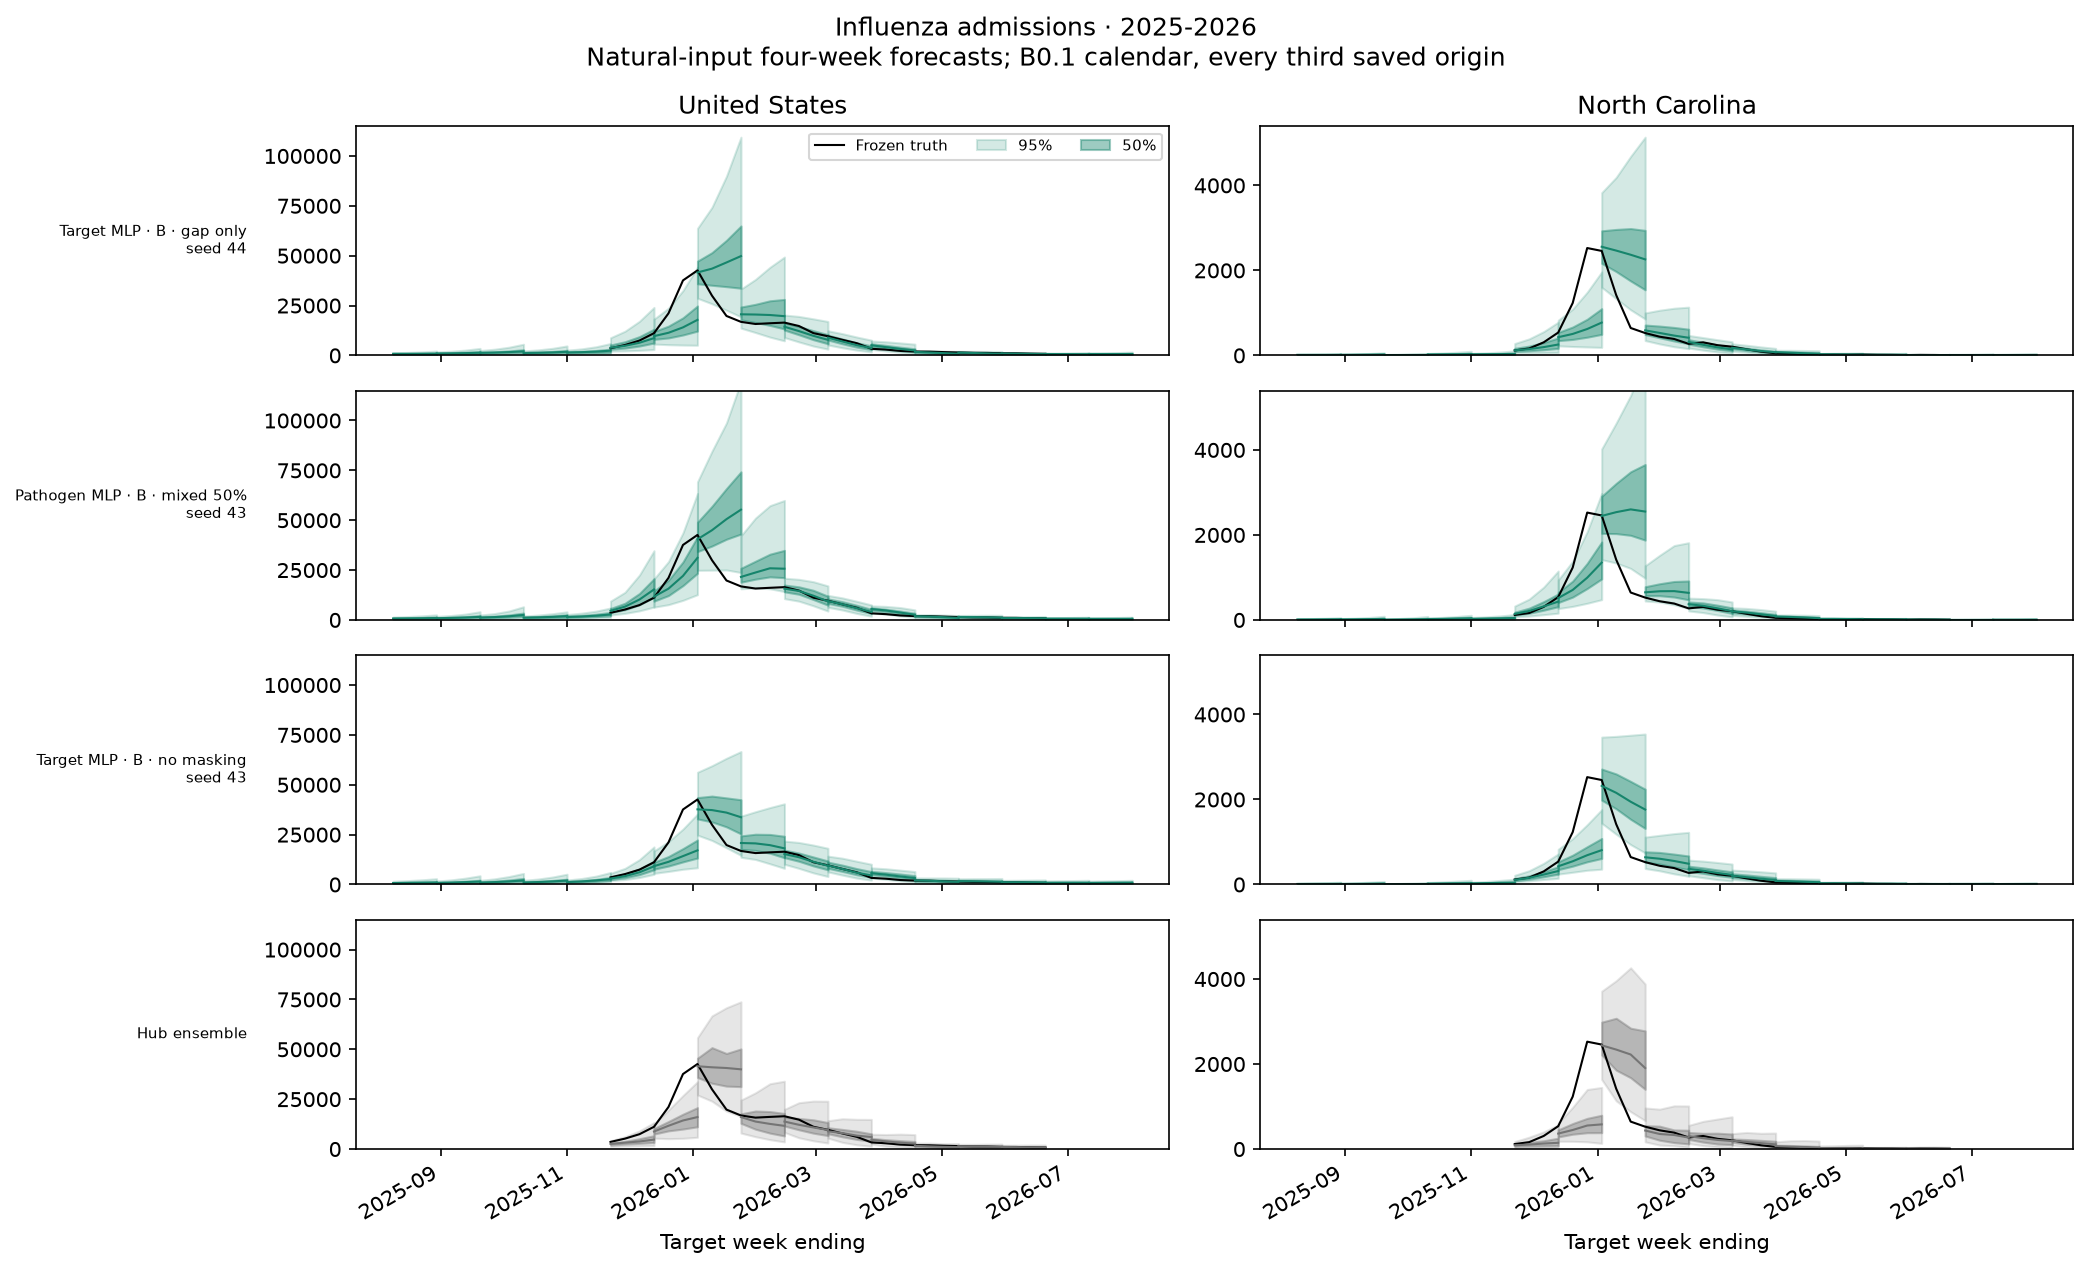
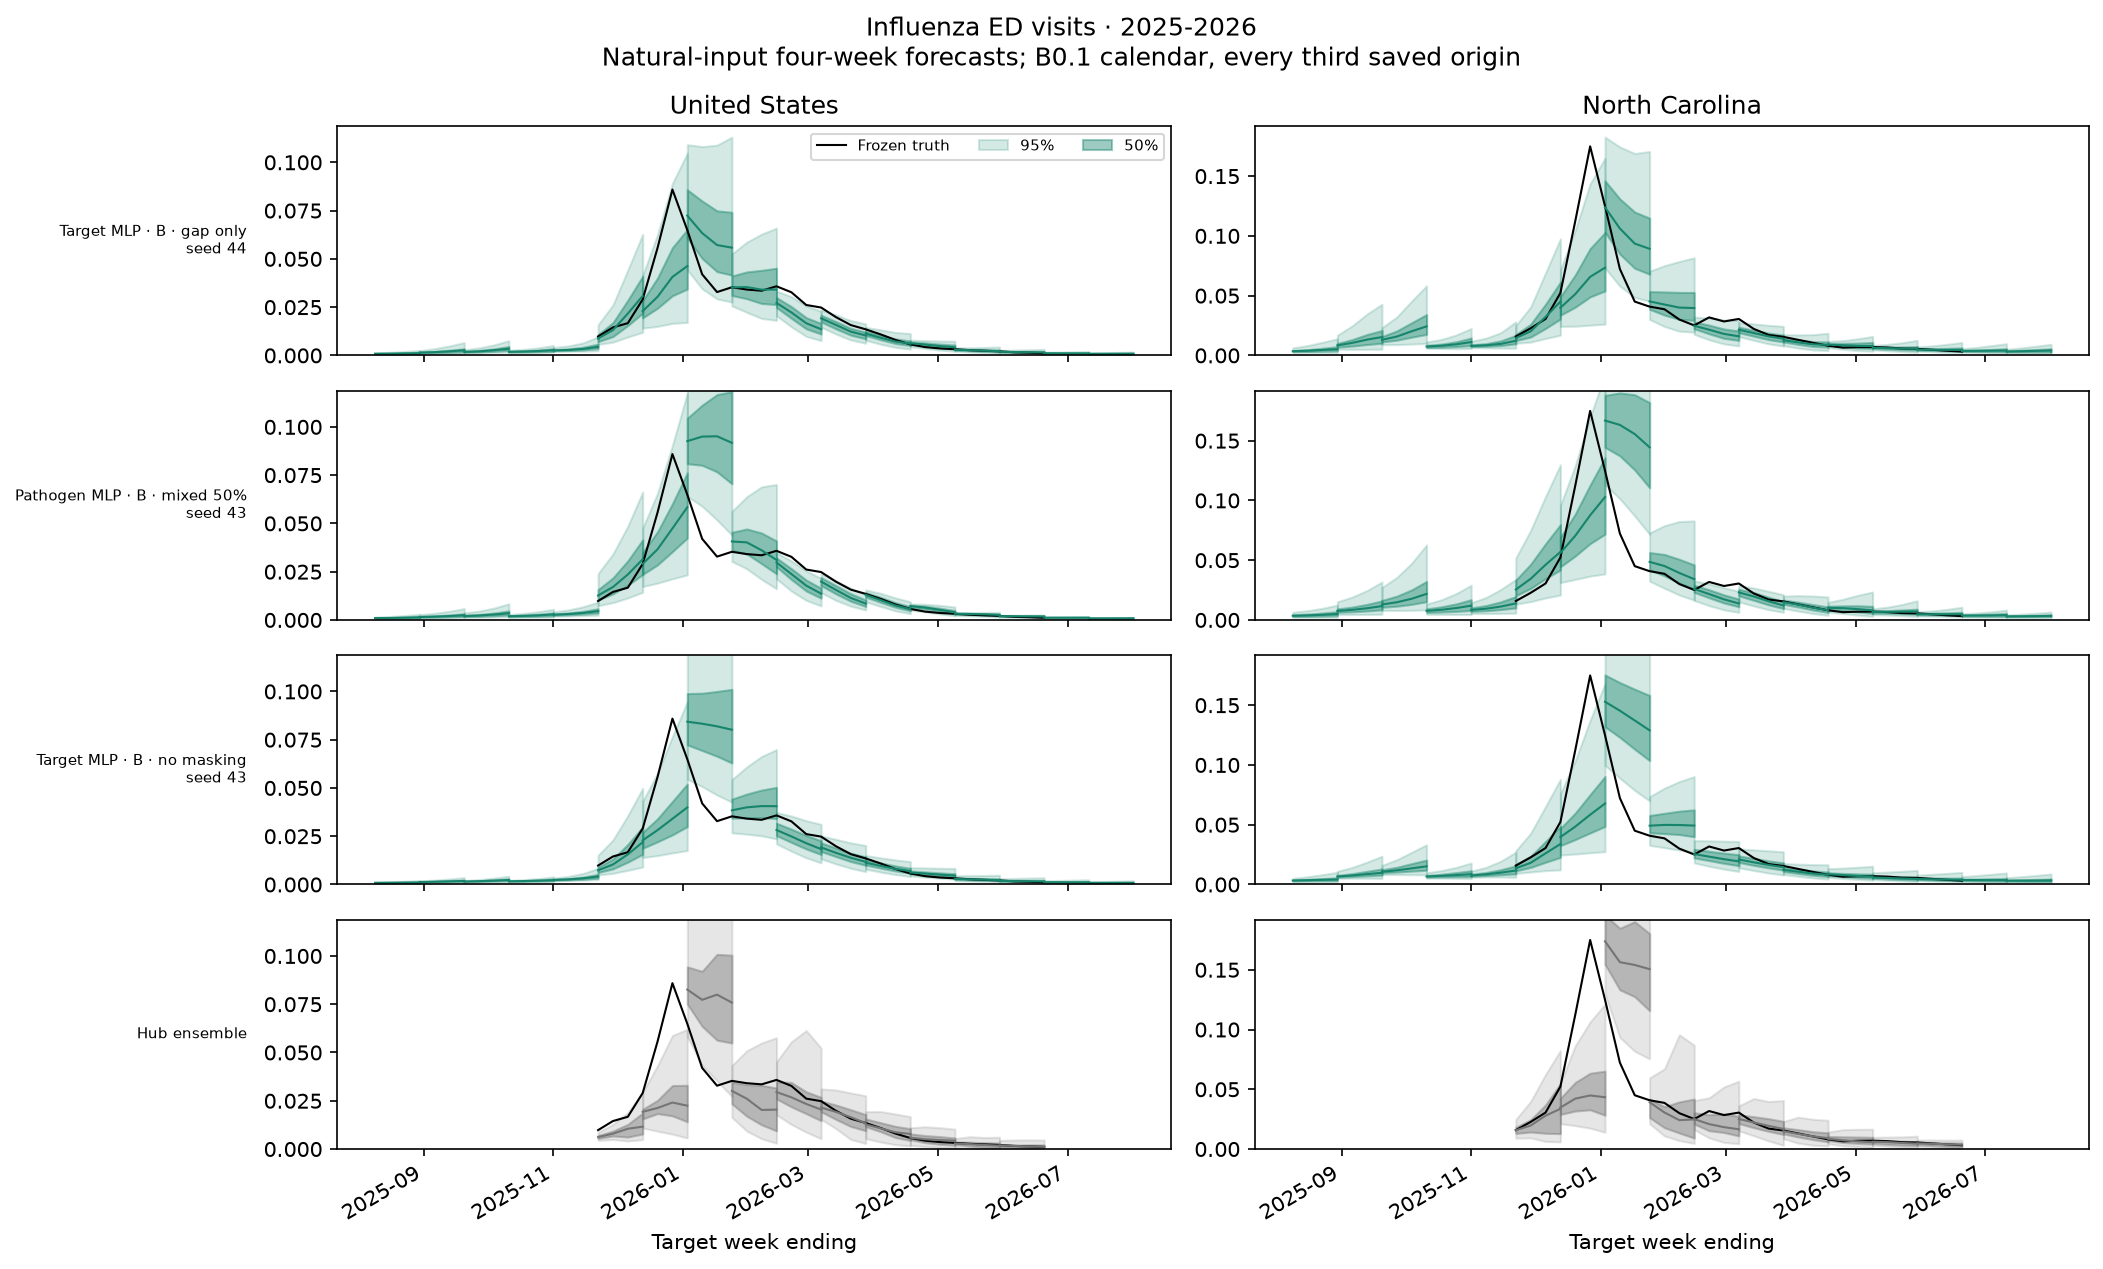
Matched A/B/C/two-stage comparison
Pathogen MLP, mixed masking 50%, fixed seed 42 for every formulation, followed by the Hub ensemble. This seed was fixed for comparability, not chosen for its score.
Assumptions and limits
- Retrospective development CV: older inputs are finalized and missing recent vintage reports can receive supplied finals. This is not prospective deployment performance.
- The same seasons informed architecture selection and this ranking. Three seeds do not measure all sources of uncertainty; small gaps remain unresolved.
- Fan examples use US and North Carolina and a stated seed selection rule. No result is inferred from visual inspection of the plots.
- Completed attempts are resolved newest-complete first from manager records; saved score tables must have identical frozen support. Models are not refitted or rescored to create this page.
- Standalone nowcast ranking is omitted: the existing cross-formulation scorer rejects mismatched nowcast cell support. Forecast skill does not establish nowcast accuracy; those scores need a separate common-support comparison against persistence, not the Hub ensemble.
- B0.1 is context, not a controlled comparison: input histories and evaluation draw budgets differ. This page does not attribute the B0/B1 score gap to one change.
Reproducing
.venv/bin/python scripts/plot_b1_overnight.py
.venv/bin/python scripts/plot_b1_300.py
.venv/bin/python -m mkdocs build --strict
This regenerates the snapshot and figures from completed runs; it launches no training or scoring jobs. Snapshot provenance · Run status at generation · Paired contrasts.
Log
-
2026-09-17: added the completed 300-epoch follow-up, paired seed comparisons, target/season changes, coverage, and matched-budget fans. Joint MLP repeats are explicitly treated as same-budget controls.
-
2026-09-17: added the original overnight screen report while the separate 300-epoch experiment was queued. Reused saved forecast totals, the shared scientific aggregation and B1 forecast export. Explicitly separated forecast performance from nowcast accuracy and marked incomplete seed sets.
- 2026-09-17: expanded the page to all 40 ranked configurations and a numeric target/season breakdown of the leader and matched pathogen formulations; clarified that training without artificial masking remains competitive.
-
2026-09-17: matched fan dates to B0.1's full saved seasonal calendar; retained frozen support for scores and truth. Standardized disease, target, and chronological season order in fans, target/season tables, and the heatmap.
-
2026-09-17: corrected the two-stage flag description after inspecting the frozen screen code:
encodeconsumes known-final flags andforwardbypasses visible finals. This was a prose error; no results or experiment snapshots changed.