B0 calibration: the crosses experiment (legacy, superseded)¶
Superseded — kept only as a historical record
This page describes b0-crosses, fitted before the per-location input
scaling fix (commit 11a23ea). Under the single pooled scale documented
here, the US sat at roughly 40× a state's model units, which collapsed its
intervals — that is the cause of the "US looks wrong" section below, and it
is now fixed. The replacement experiment is
the us-cross-4 crosses calibration, and its
conclusions differ materially: the leading recipe is no longer a conv
variant, and the state/US disagreement largely disappears.
The fit artifacts for this experiment have been deleted to reclaim disk
(data/experiments/ now holds only b0-us-cross-4), so nothing on this page
can be regenerated or re-ranked. The numbers below are the only surviving
record, and they should not be quoted as current B0 performance.
Experiment: b0-crosses · Suite: crosses · Status: complete —
51 configurations × 3 seeds = 153 season-CV runs, 459 season fits.
Fitted 2026-09-15 03:48–04:24 UTC on the patron GPU nodes g1803jles01 (90 runs)
and g1803jles02 (63 runs).
This is the smaller calibration that replaced the cancelled 4,097-configuration
b0-sweep. It screens one-factor changes around three pre-chosen reference
recipes — it does not estimate interactions, and the references were design
choices, not winners picked from the partial sweep.
| Reference | Recipe | Combined score | Rank |
|---|---|---|---|
raw |
Historical raw-count B0, 8 weeks, no geography/dynamics | 1.1072 | 44 |
anchor |
Fourth-root, geography, dynamics, 12 weeks, shared MLP | 0.9888 | 27 |
conv |
Anchor + convolution, residual decoder, latent 32, spatial attention, local noise, separate heads, logit ED | 0.9765 | 20 |
Score definition¶
The selection score follows architecture §10.3 and is
computed by tapestry.evaluation.totals from each run's totals.csv:
- Per target and season: total model WIS ÷ total ensemble WIS over identical frozen tasks (every location including US, every reference date, horizons 0–3, on the hub's 23 quantiles). No per-task or per-location ratio is averaged.
- Per target: mean of its season ratios, each season equal.
- Combined:
(2 × (flu + COVID + RSV admissions) + (flu + COVID + RSV ED)) / 9. - Per configuration: mean and seed SD over the three seeds.
Lower is better; 1.0 means parity with the official hub ensemble.
Ranking artifacts live in the experiment folder (not tracked in Git):
data/experiments/b0-crosses/ranking-66c35025d66c/ —
configuration_ranking.csv, run_scores.csv, season_scores.csv, manifest.json.
The three best models¶
| Rank | Configuration | Combined (mean ± seed SD) | States/DC | US | Scenario |
|---|---|---|---|---|---|
| 1 | conv__heads_sh |
0.9220 ± 0.0739 | 0.9453 | 0.9687 | …enc_conv:sp_attn:hd_sh:dec_res2:nz_loc:z32… |
| 2 | conv__lookback_8 |
0.9256 ± 0.0264 | 0.9185 | 1.2197 | b0:h8:…enc_conv:sp_attn:hd_su:dec_res2:nz_loc:z32… |
| 3 | conv__geography_0 |
0.9382 ± 0.0155 | 0.9305 | 1.2387 | …geo0:…enc_conv:sp_attn:hd_su:dec_res2:nz_loc:z32… |
All three are one-factor changes on the conv reference. Per-target means:
| Configuration | Flu adm. | COVID adm. | RSV adm. | Flu ED | COVID ED | RSV ED |
|---|---|---|---|---|---|---|
conv__heads_sh |
0.893 | 0.897 | 0.799 | 0.956 | 1.380 | 0.784 |
conv__lookback_8 |
0.871 | 0.933 | 0.870 | 1.007 | 1.219 | 0.755 |
conv__geography_0 |
0.935 | 0.984 | 0.841 | 0.965 | 1.259 | 0.700 |
The top three are not separated
The top-10 range (0.0361) is barely above the median seed SD (0.0294), and
rank 1 has the largest seed SD in the leaderboard: conv__heads_sh
scores 0.880 / 1.007 / 0.879 on seeds 42/43/44 — one seed alone lands it at
parity. Treat these three as an indistinguishable leading group, not an
ordering. Three seeds cannot resolve differences this small.
Model ranking plots¶
One dot per model, one column per metric, models sharing rows across columns — the hub ensemble is ranked in among the configurations rather than set apart, so its row shows where it actually falls. Ordered by pooled per-task mean WIS, best on top. WIS components are per-task means; coverage is the fraction of frozen tasks inside the interval, with the nominal level marked in red.
Total WIS across all six targets¶
Columns are the six targets' total WIS, each on its own scale — raw WIS spans roughly 10² to 10⁵ between admissions and ED proportions, so they cannot share an axis. Rows are ordered by each configuration's mean WIS ratio to the ensemble across all six targets, which is scale-free.
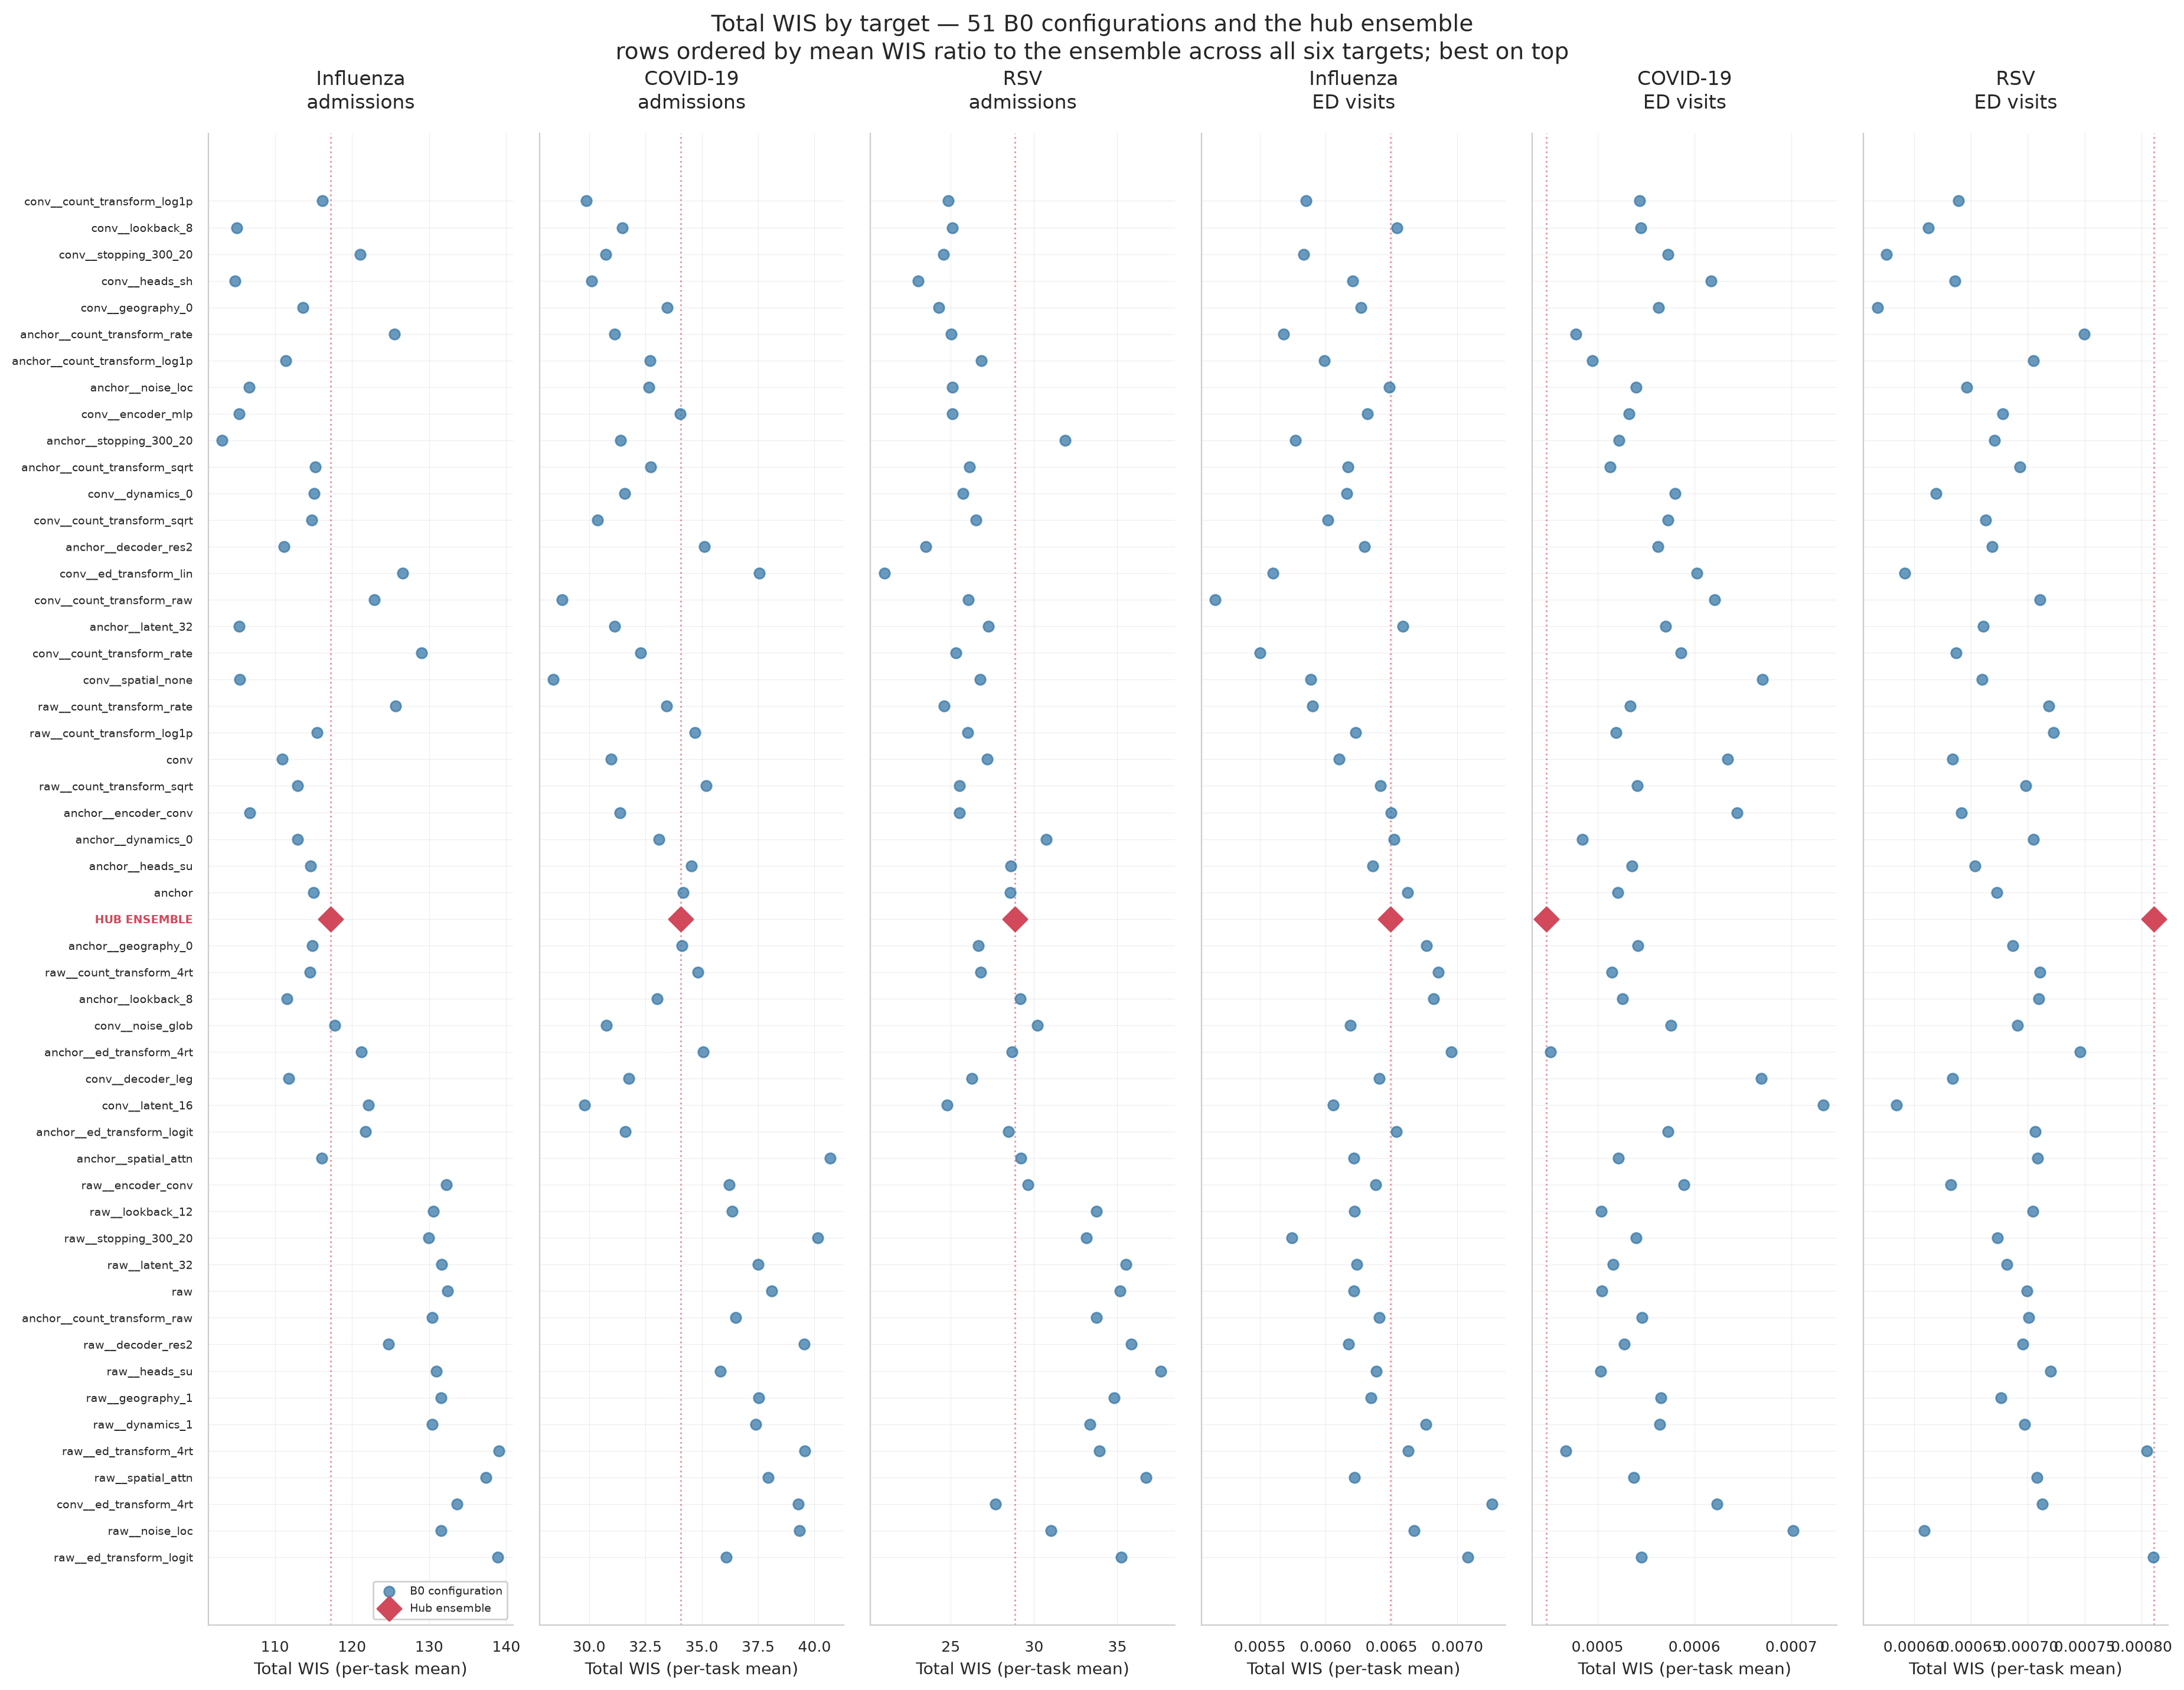
The ensemble lands at row 28 of 52 on that combined ordering: about half the configurations beat it overall, which is the same result the selection score reports, seen per target.
Per target¶
Six columns each: WIS, underprediction, overprediction, dispersion, 50% and 90% coverage — the metric set used by the influpaint component plots.
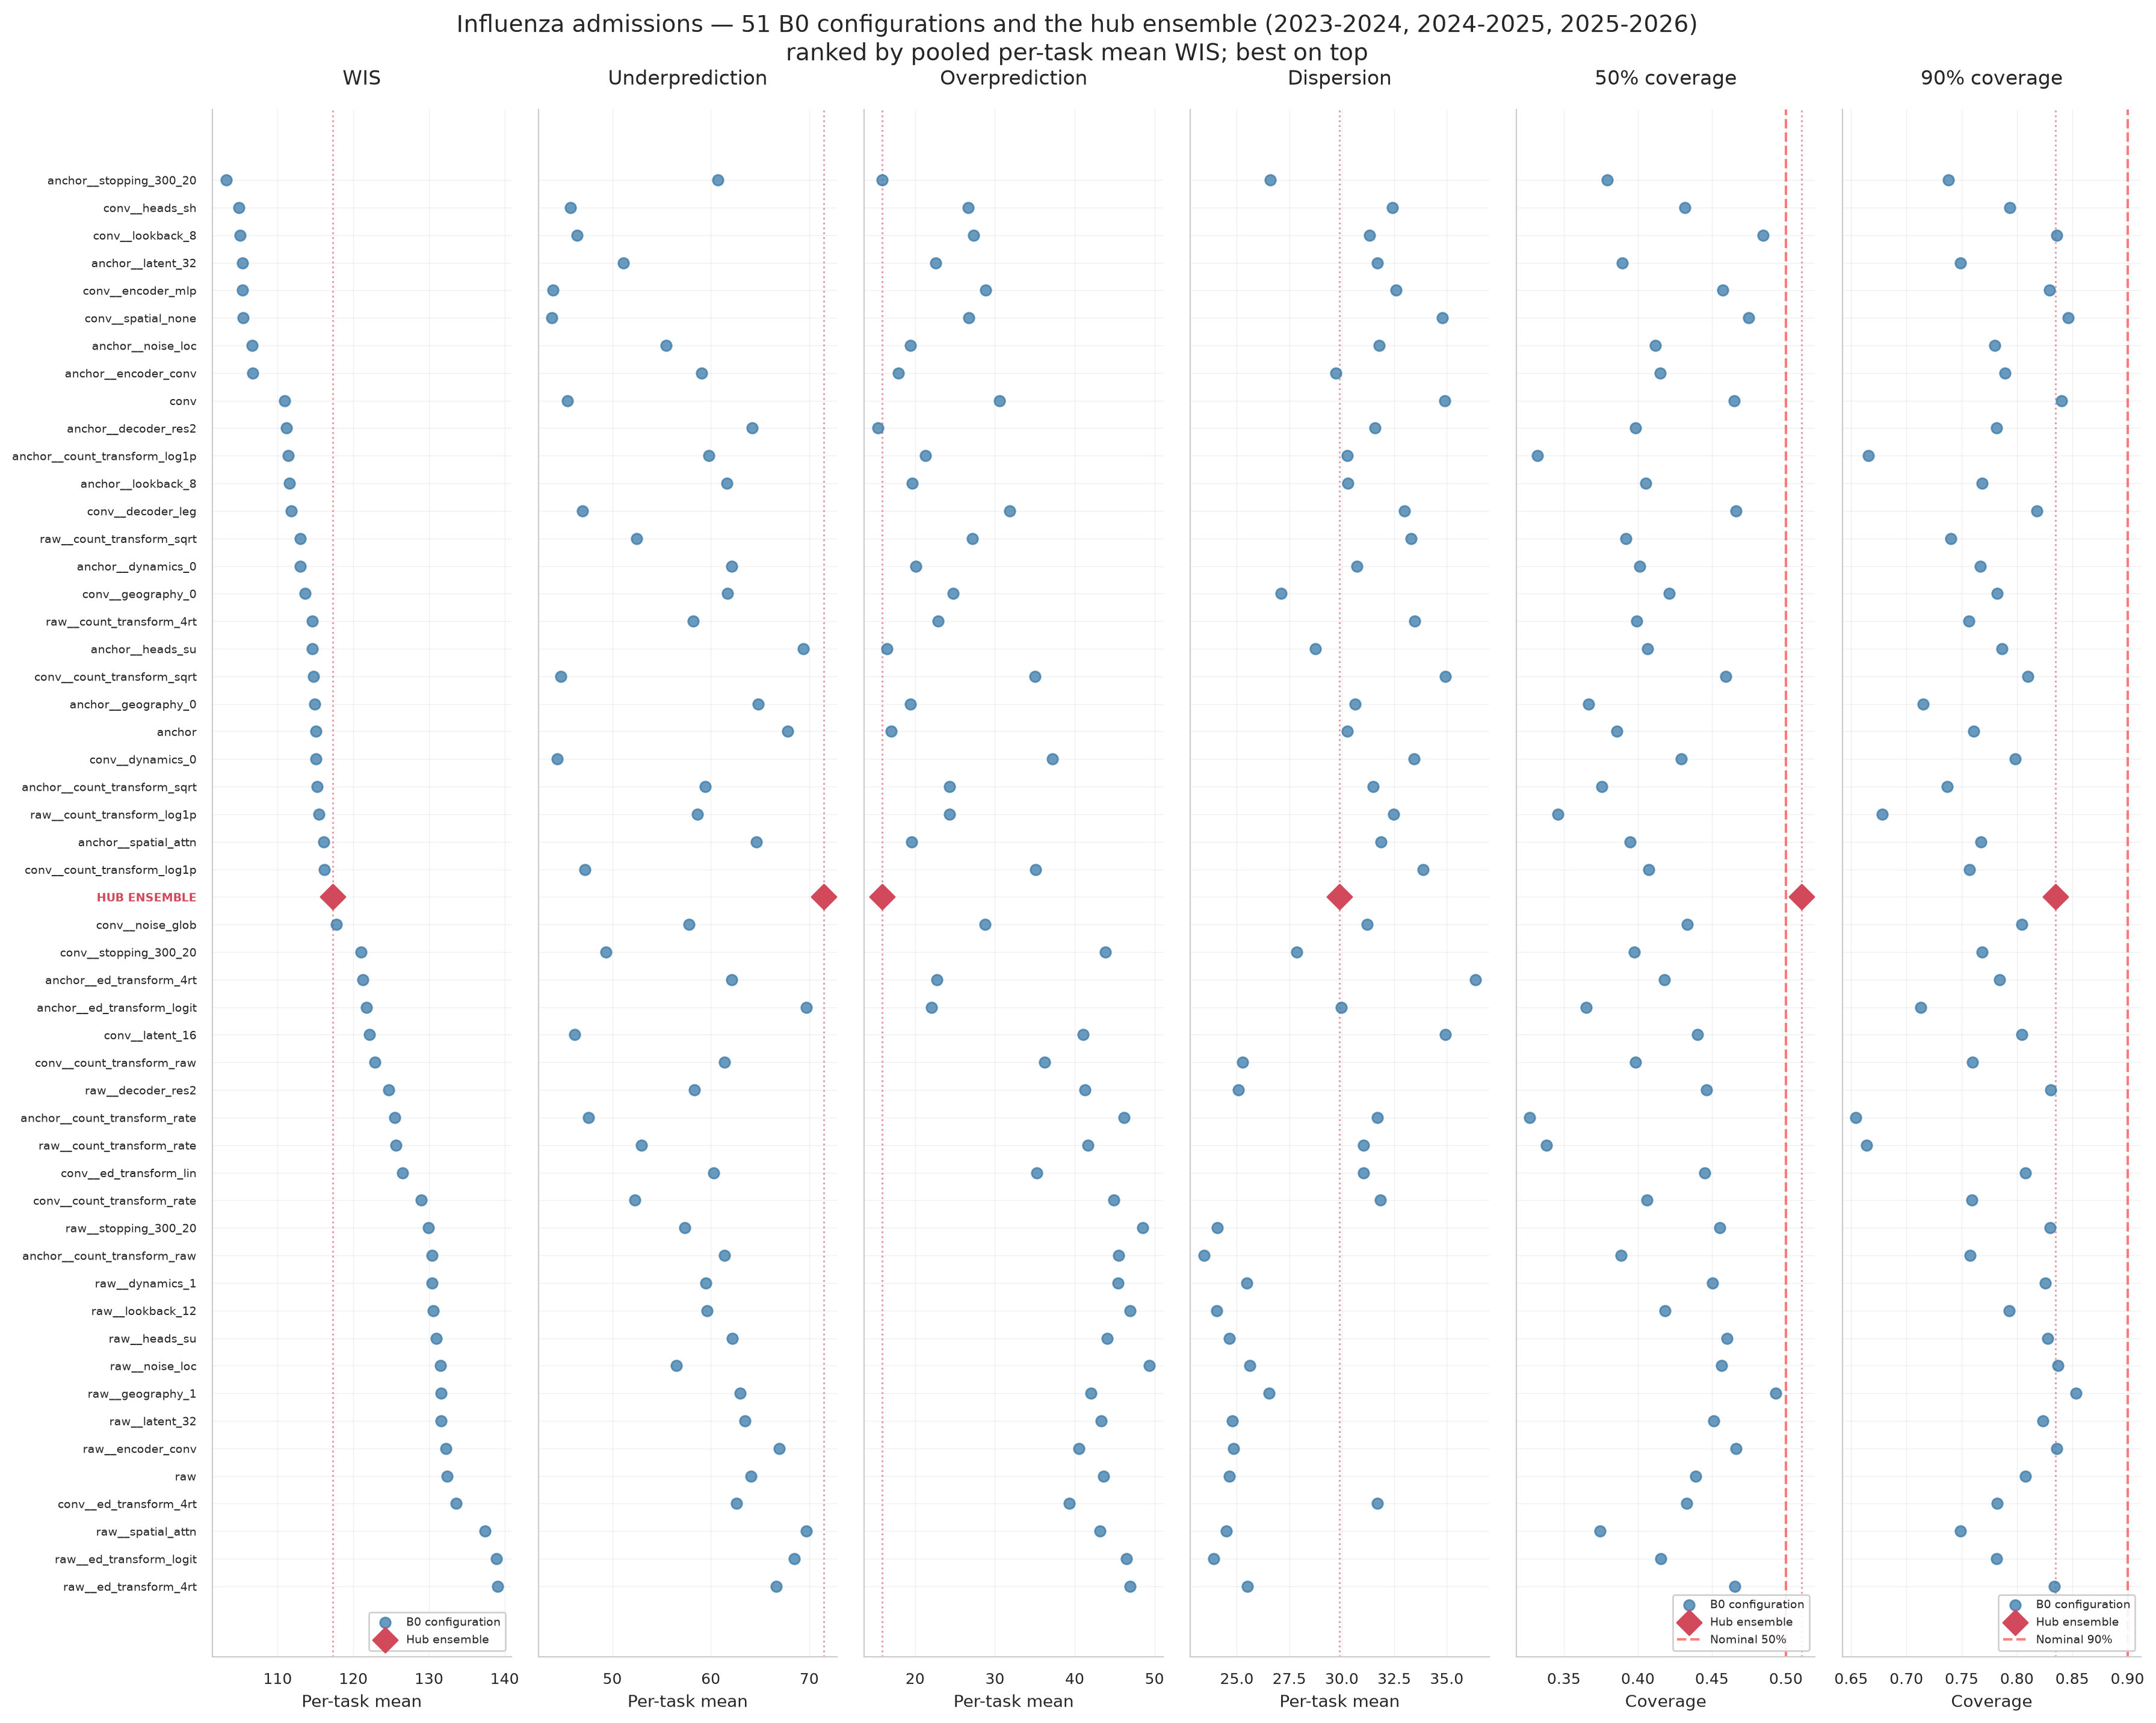
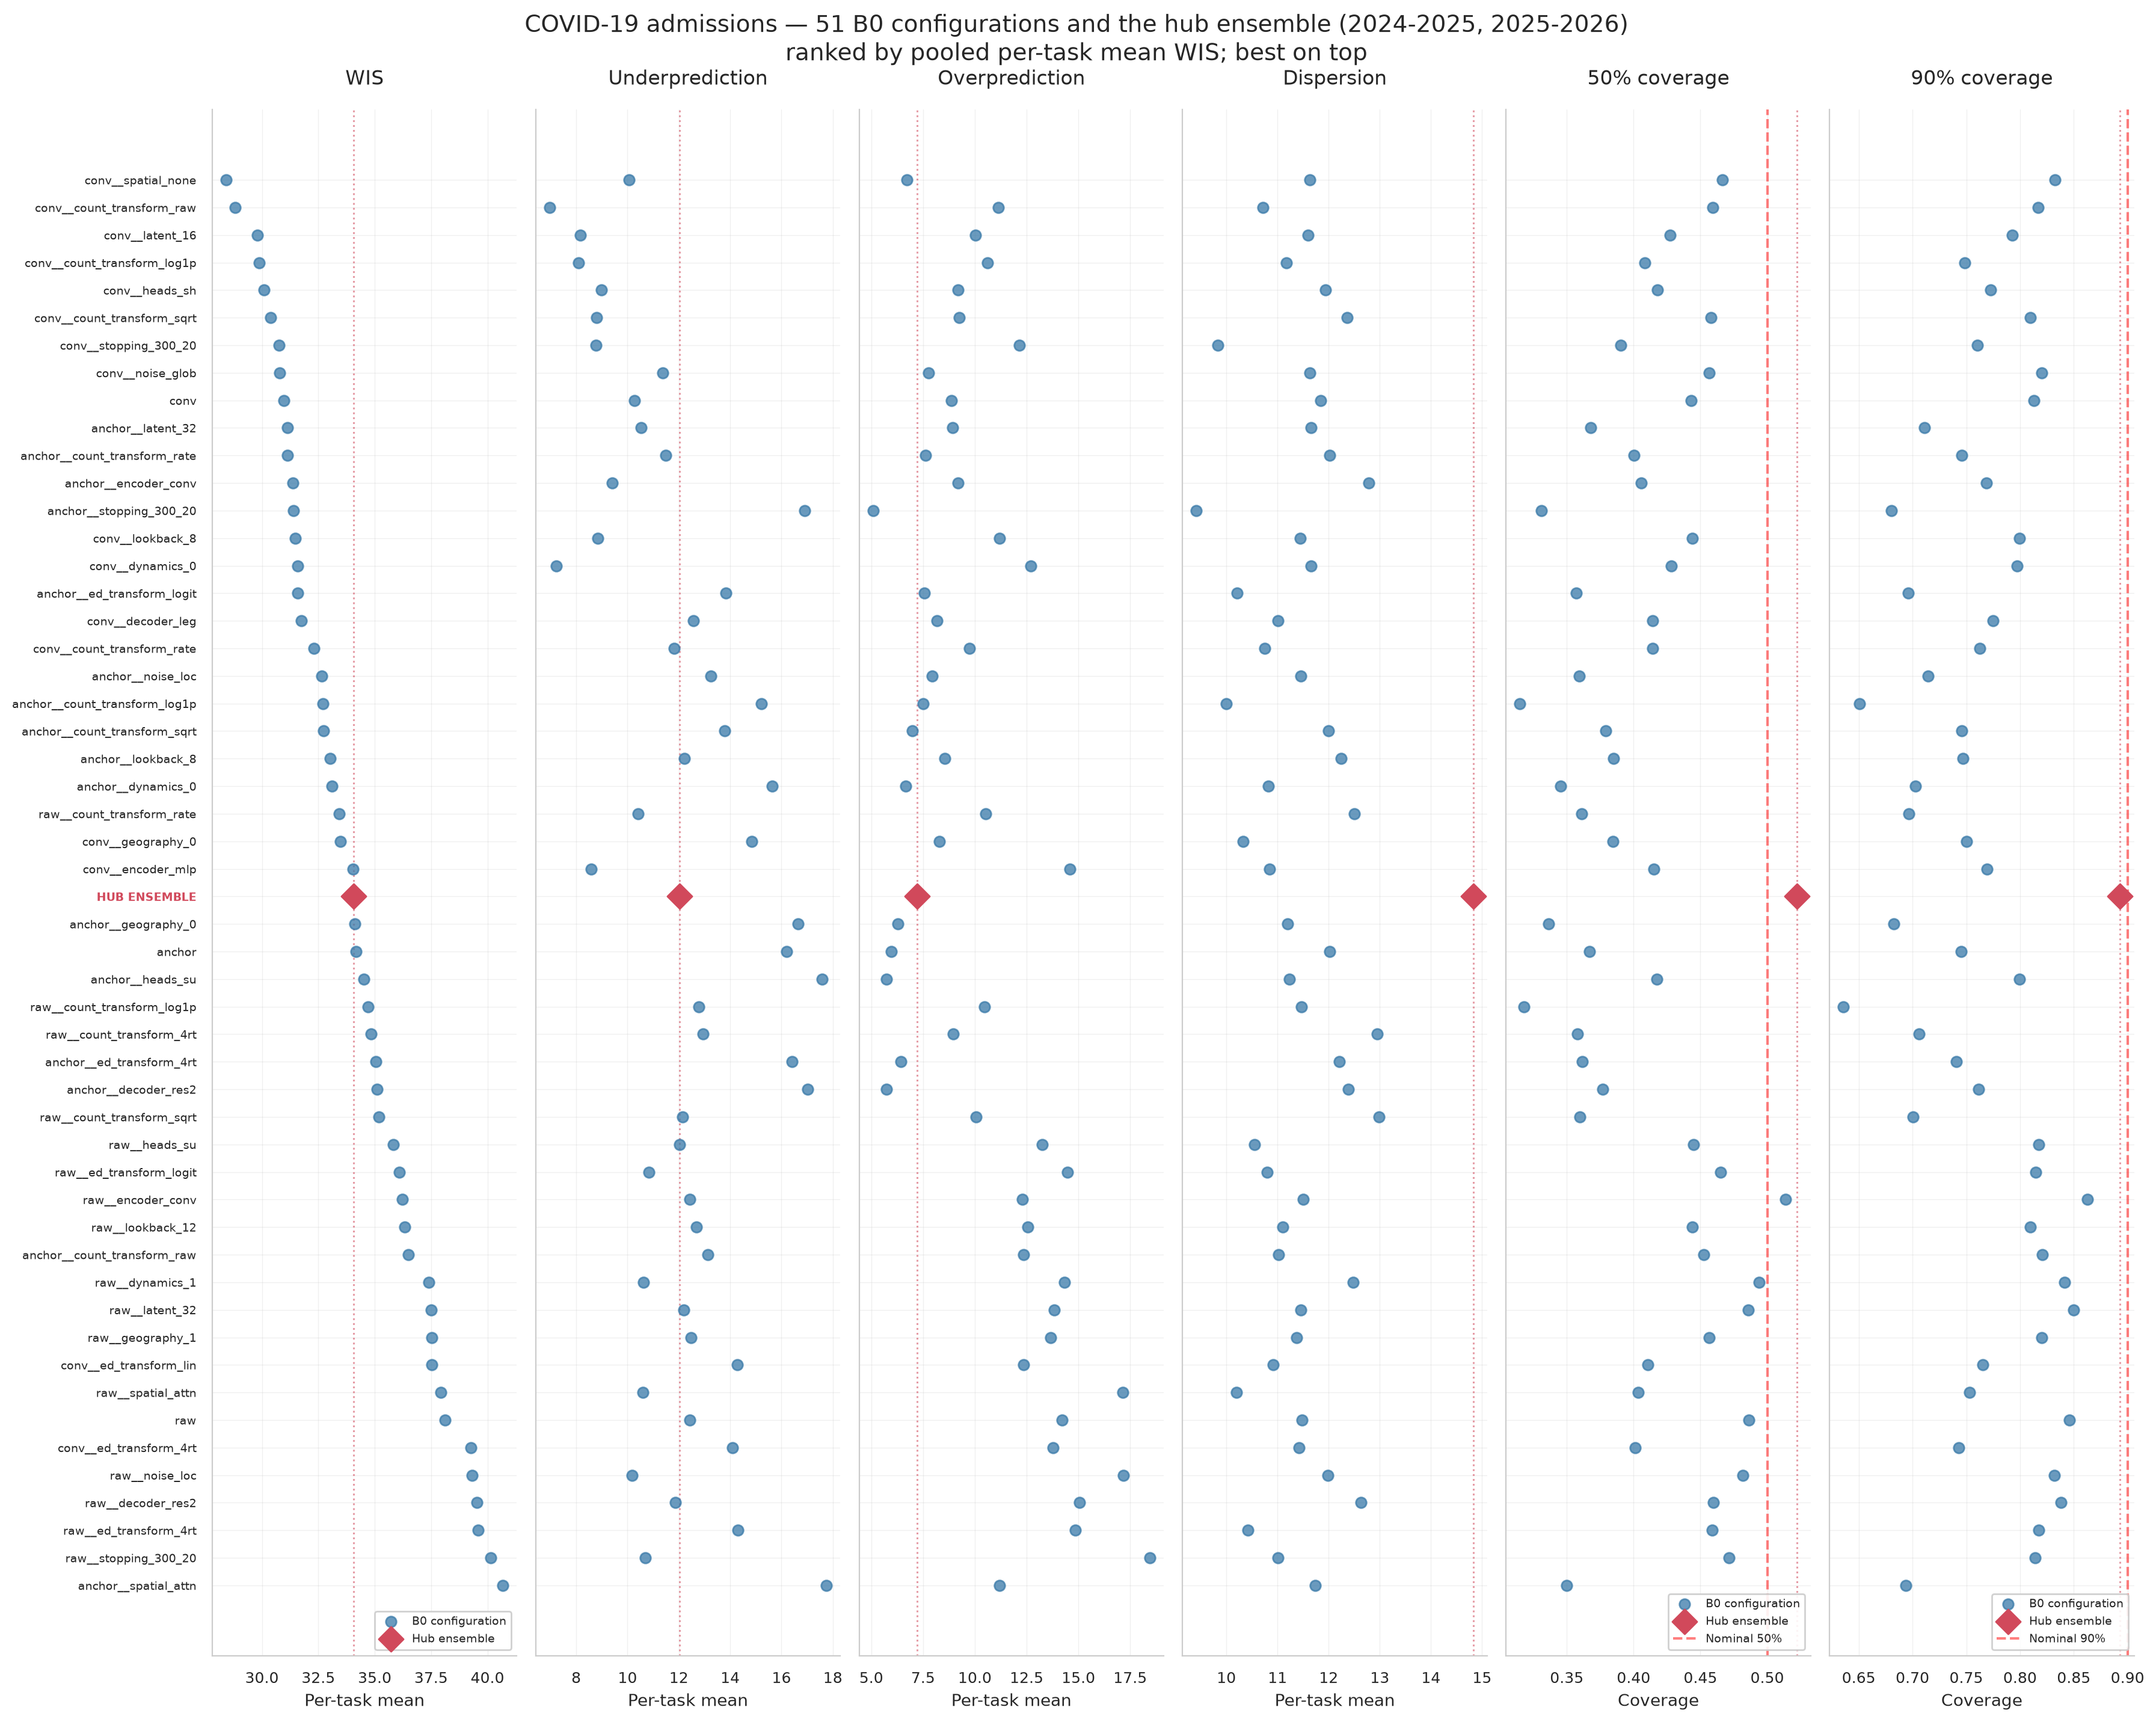
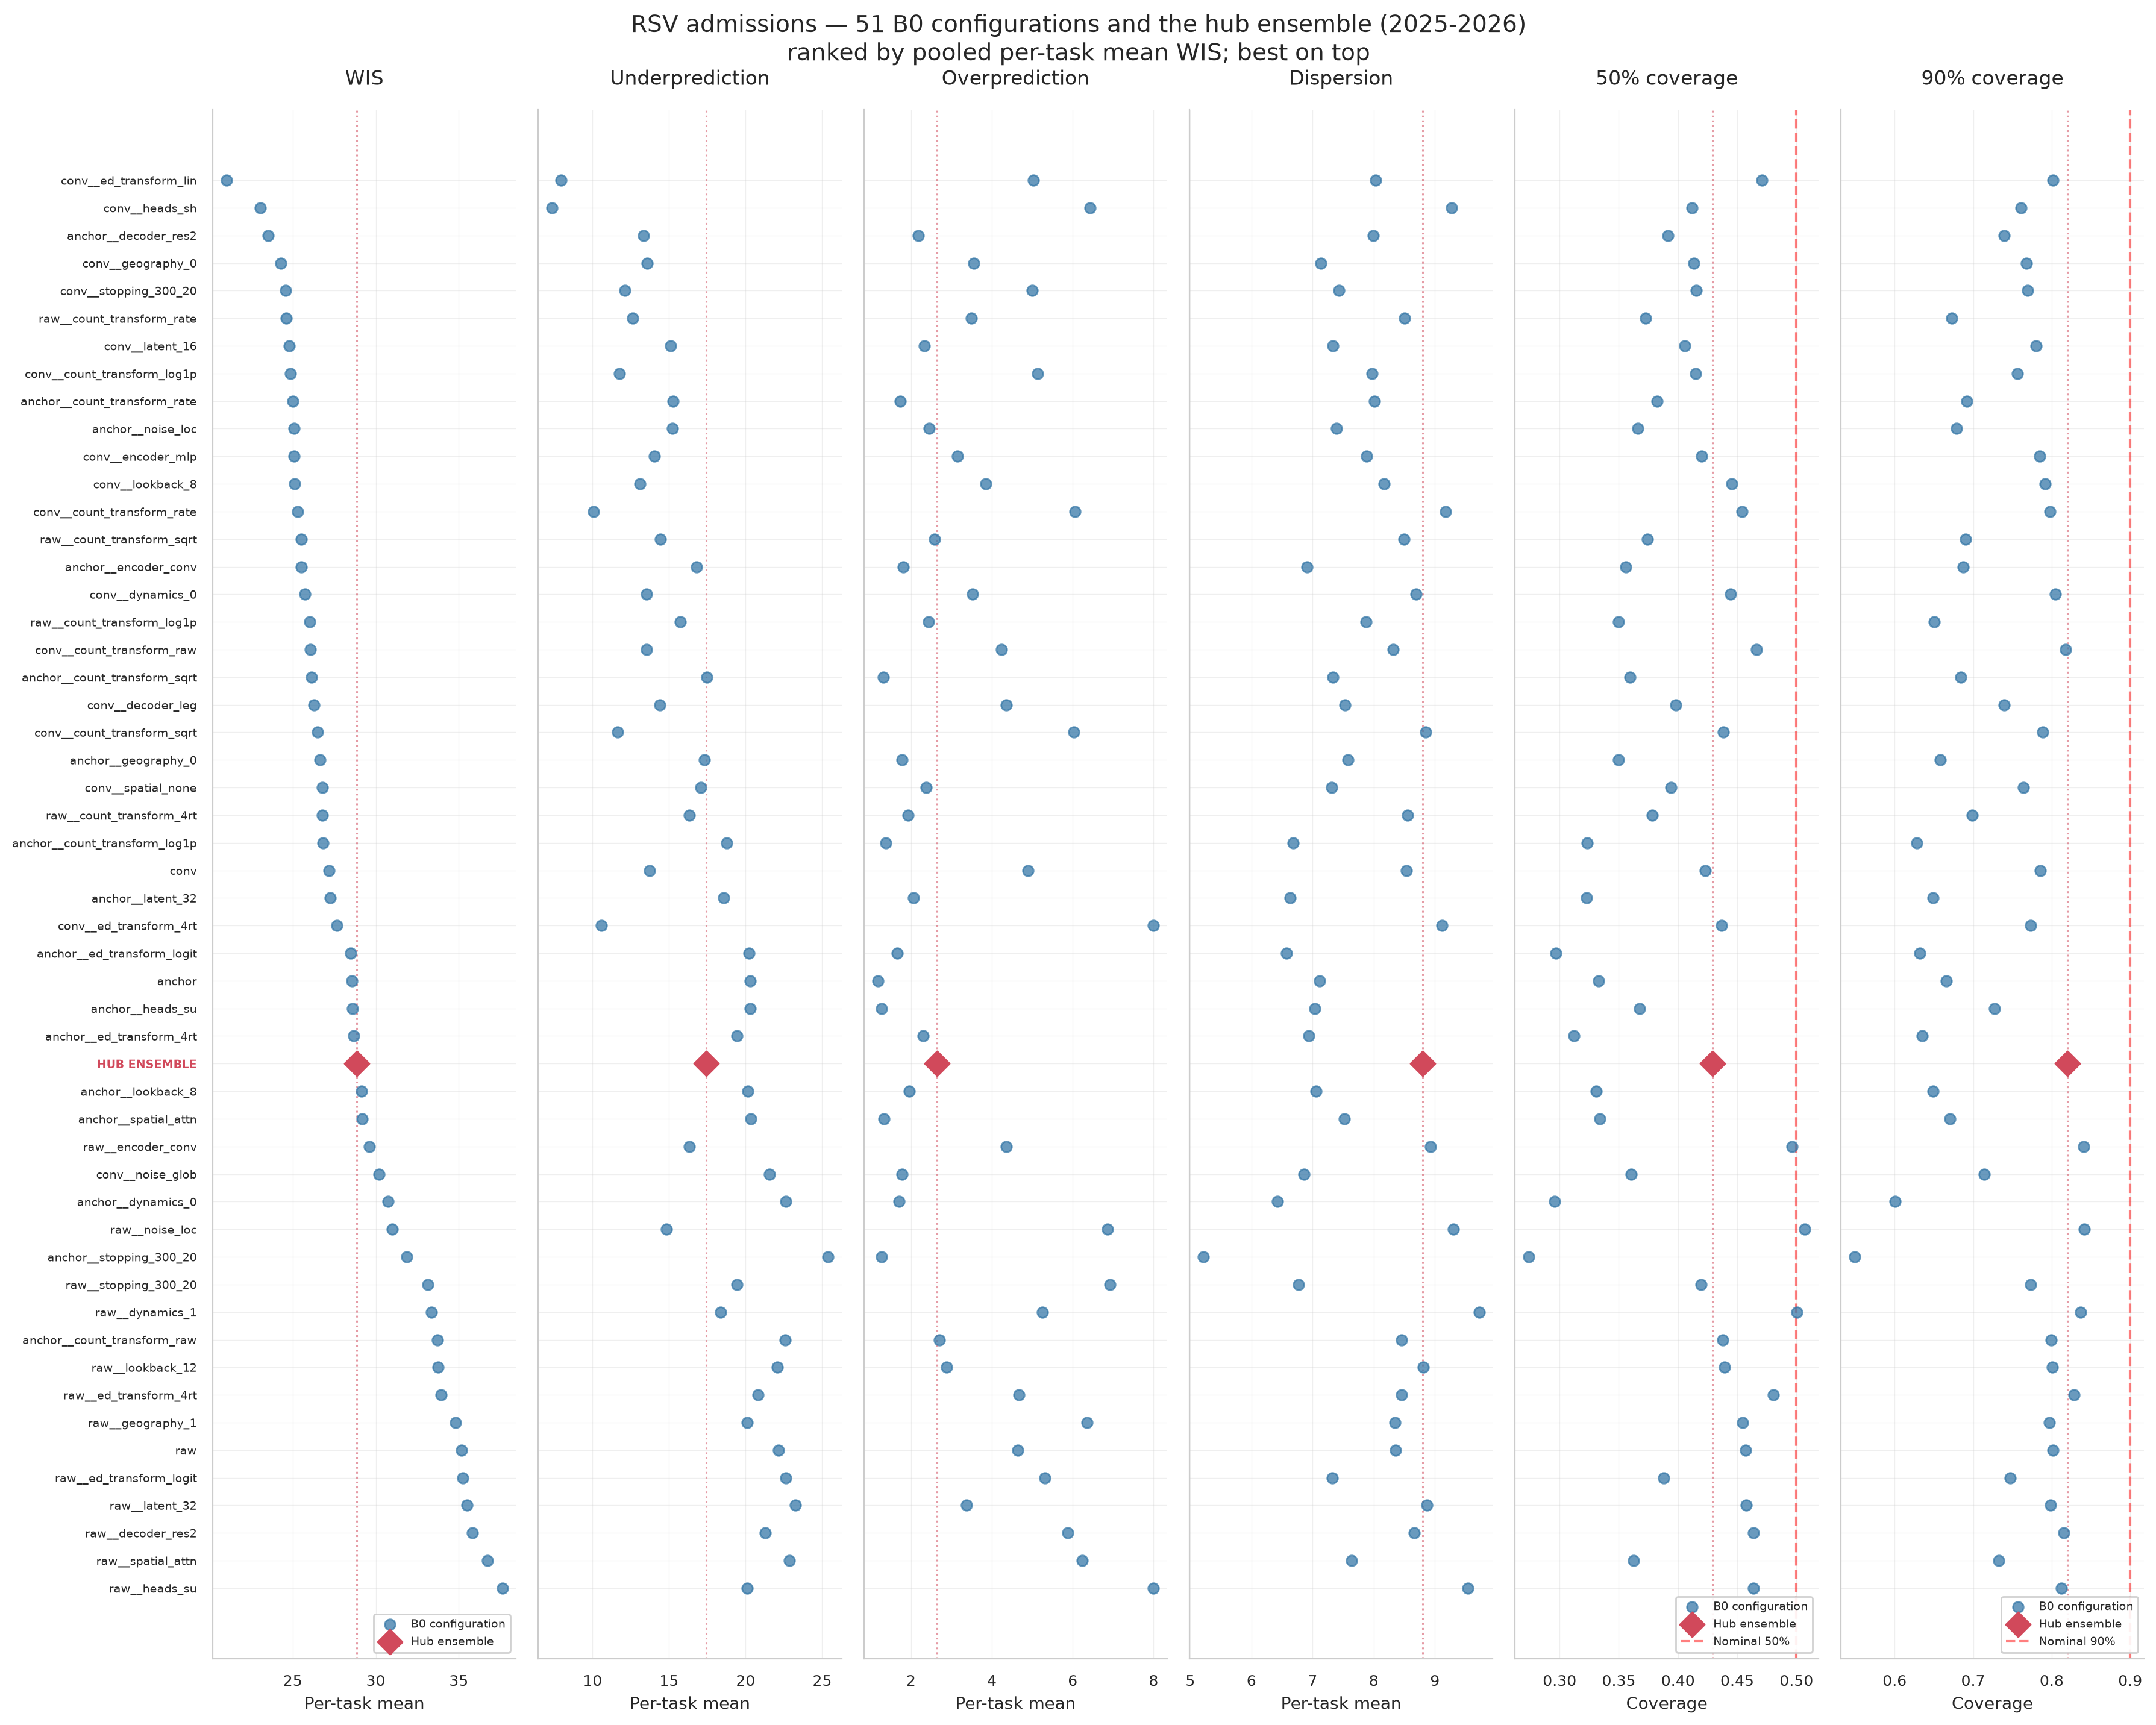
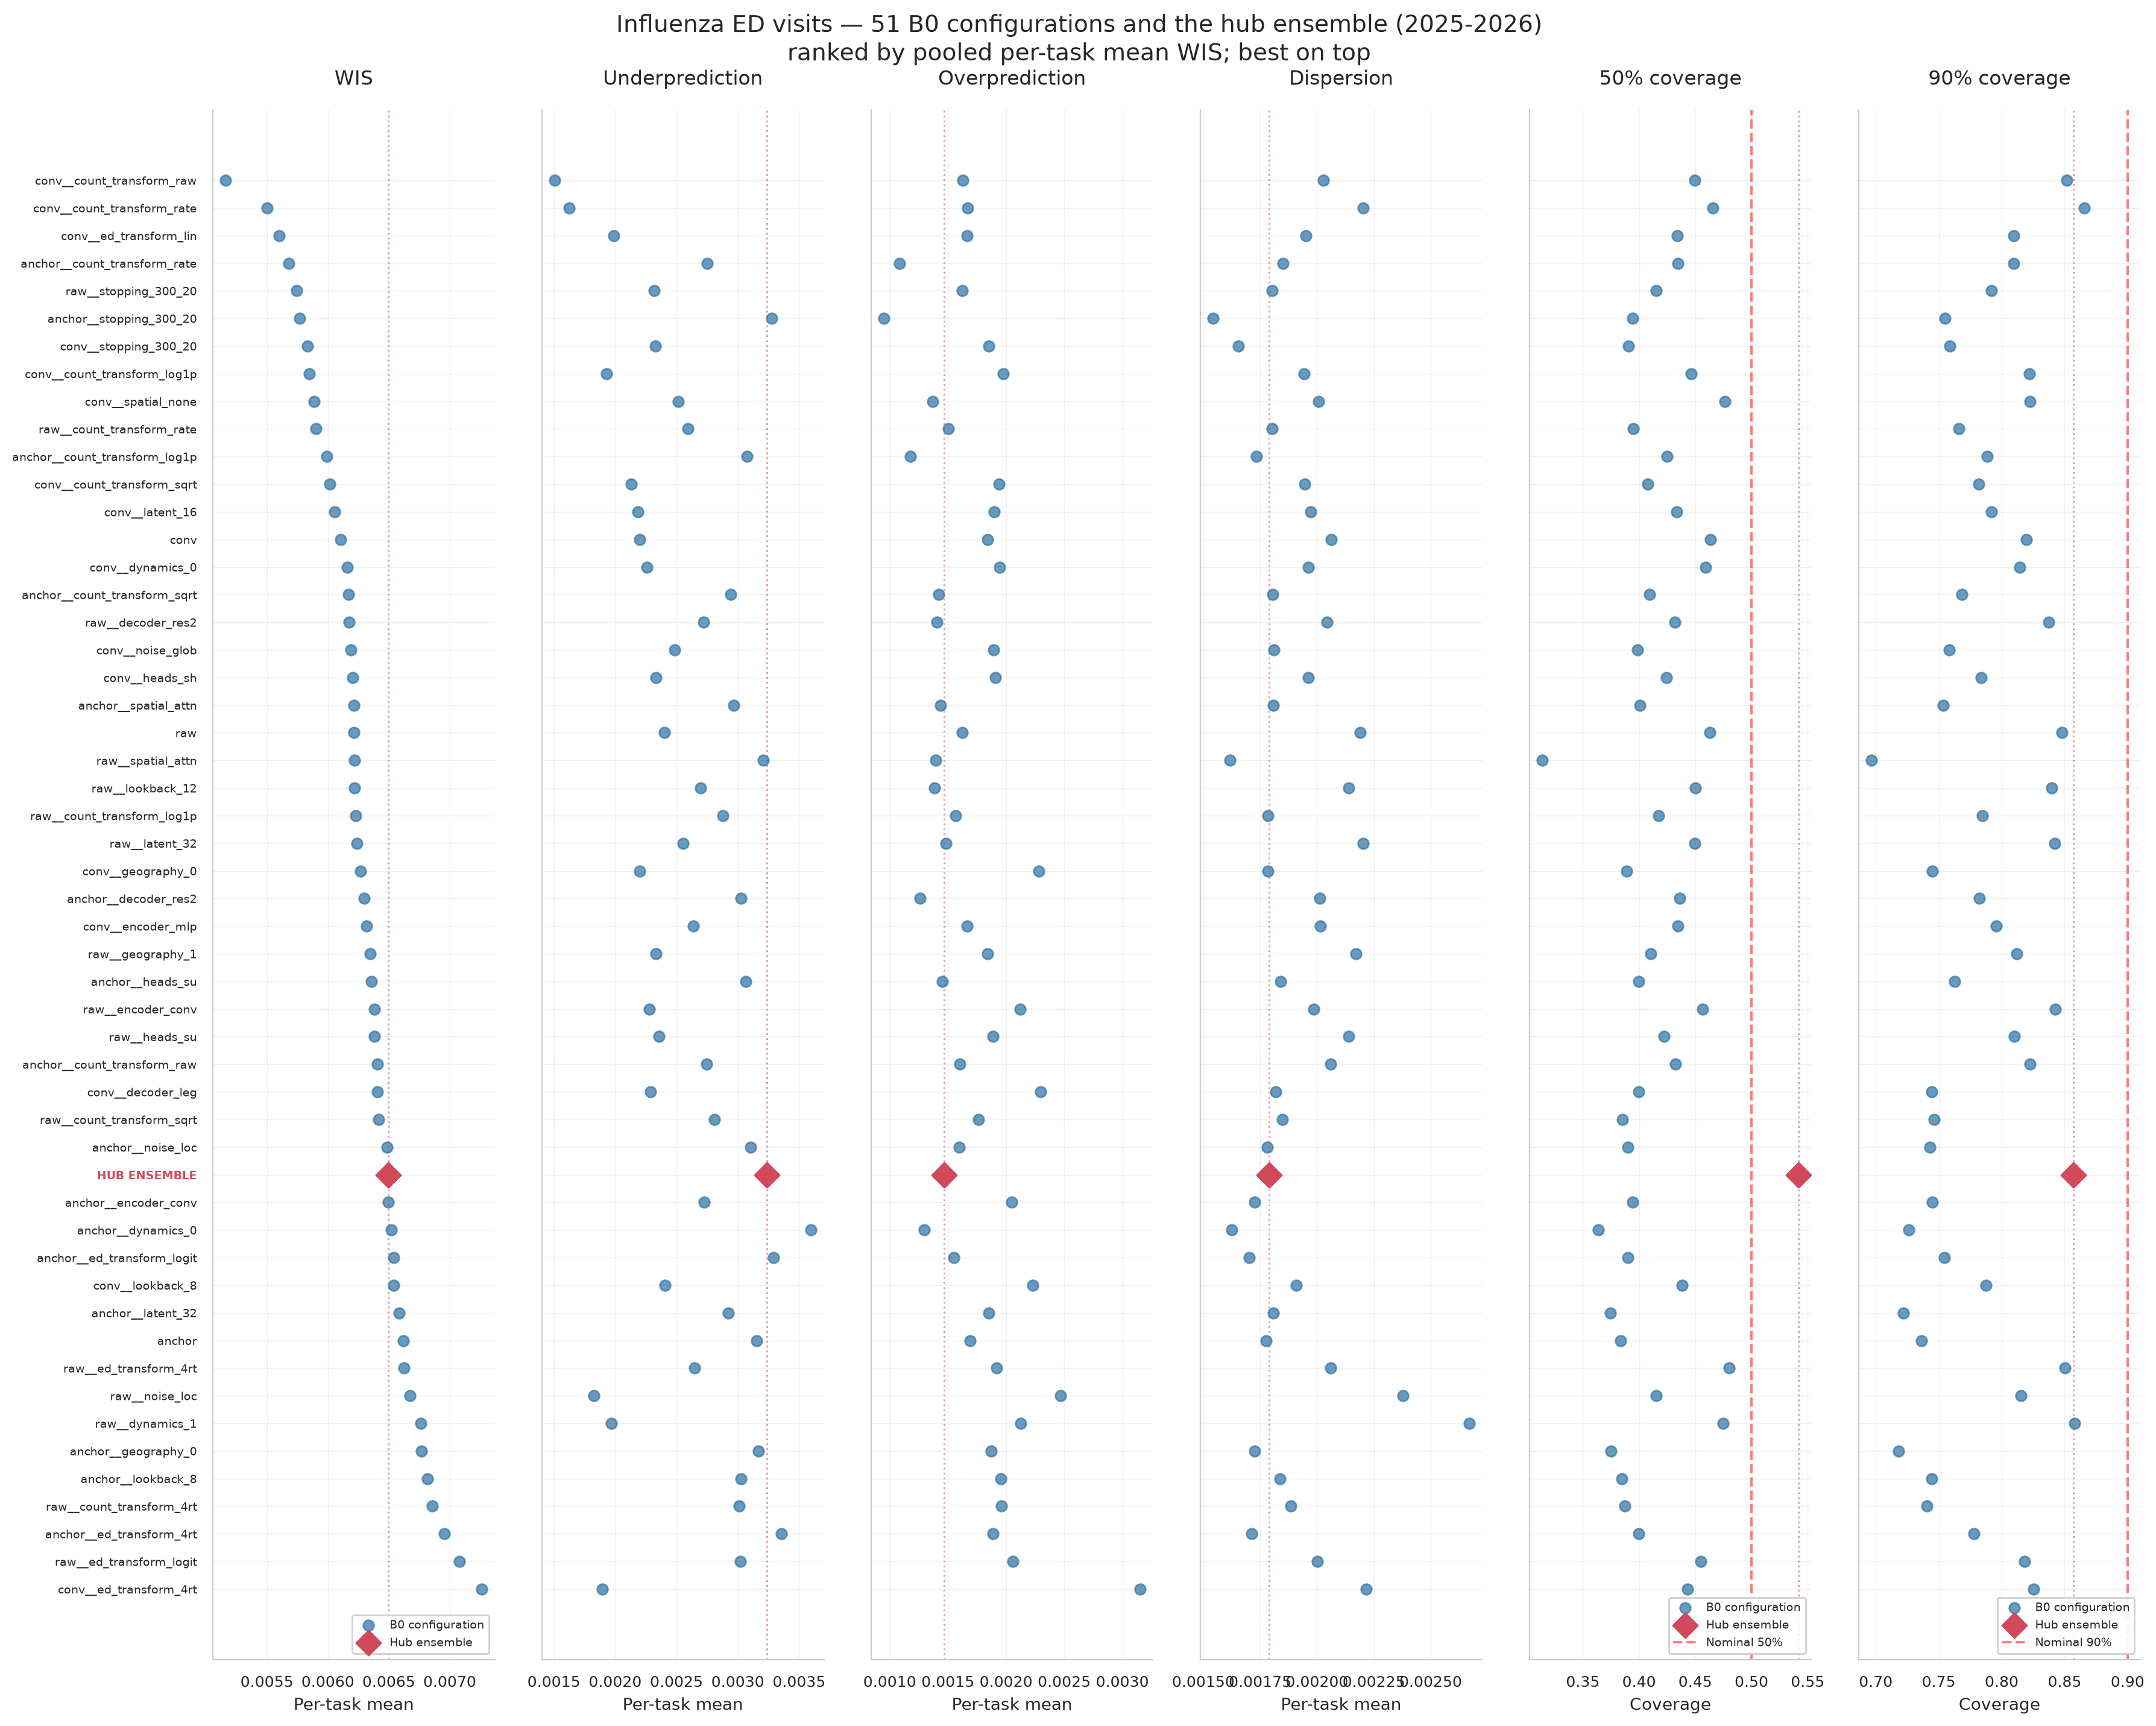
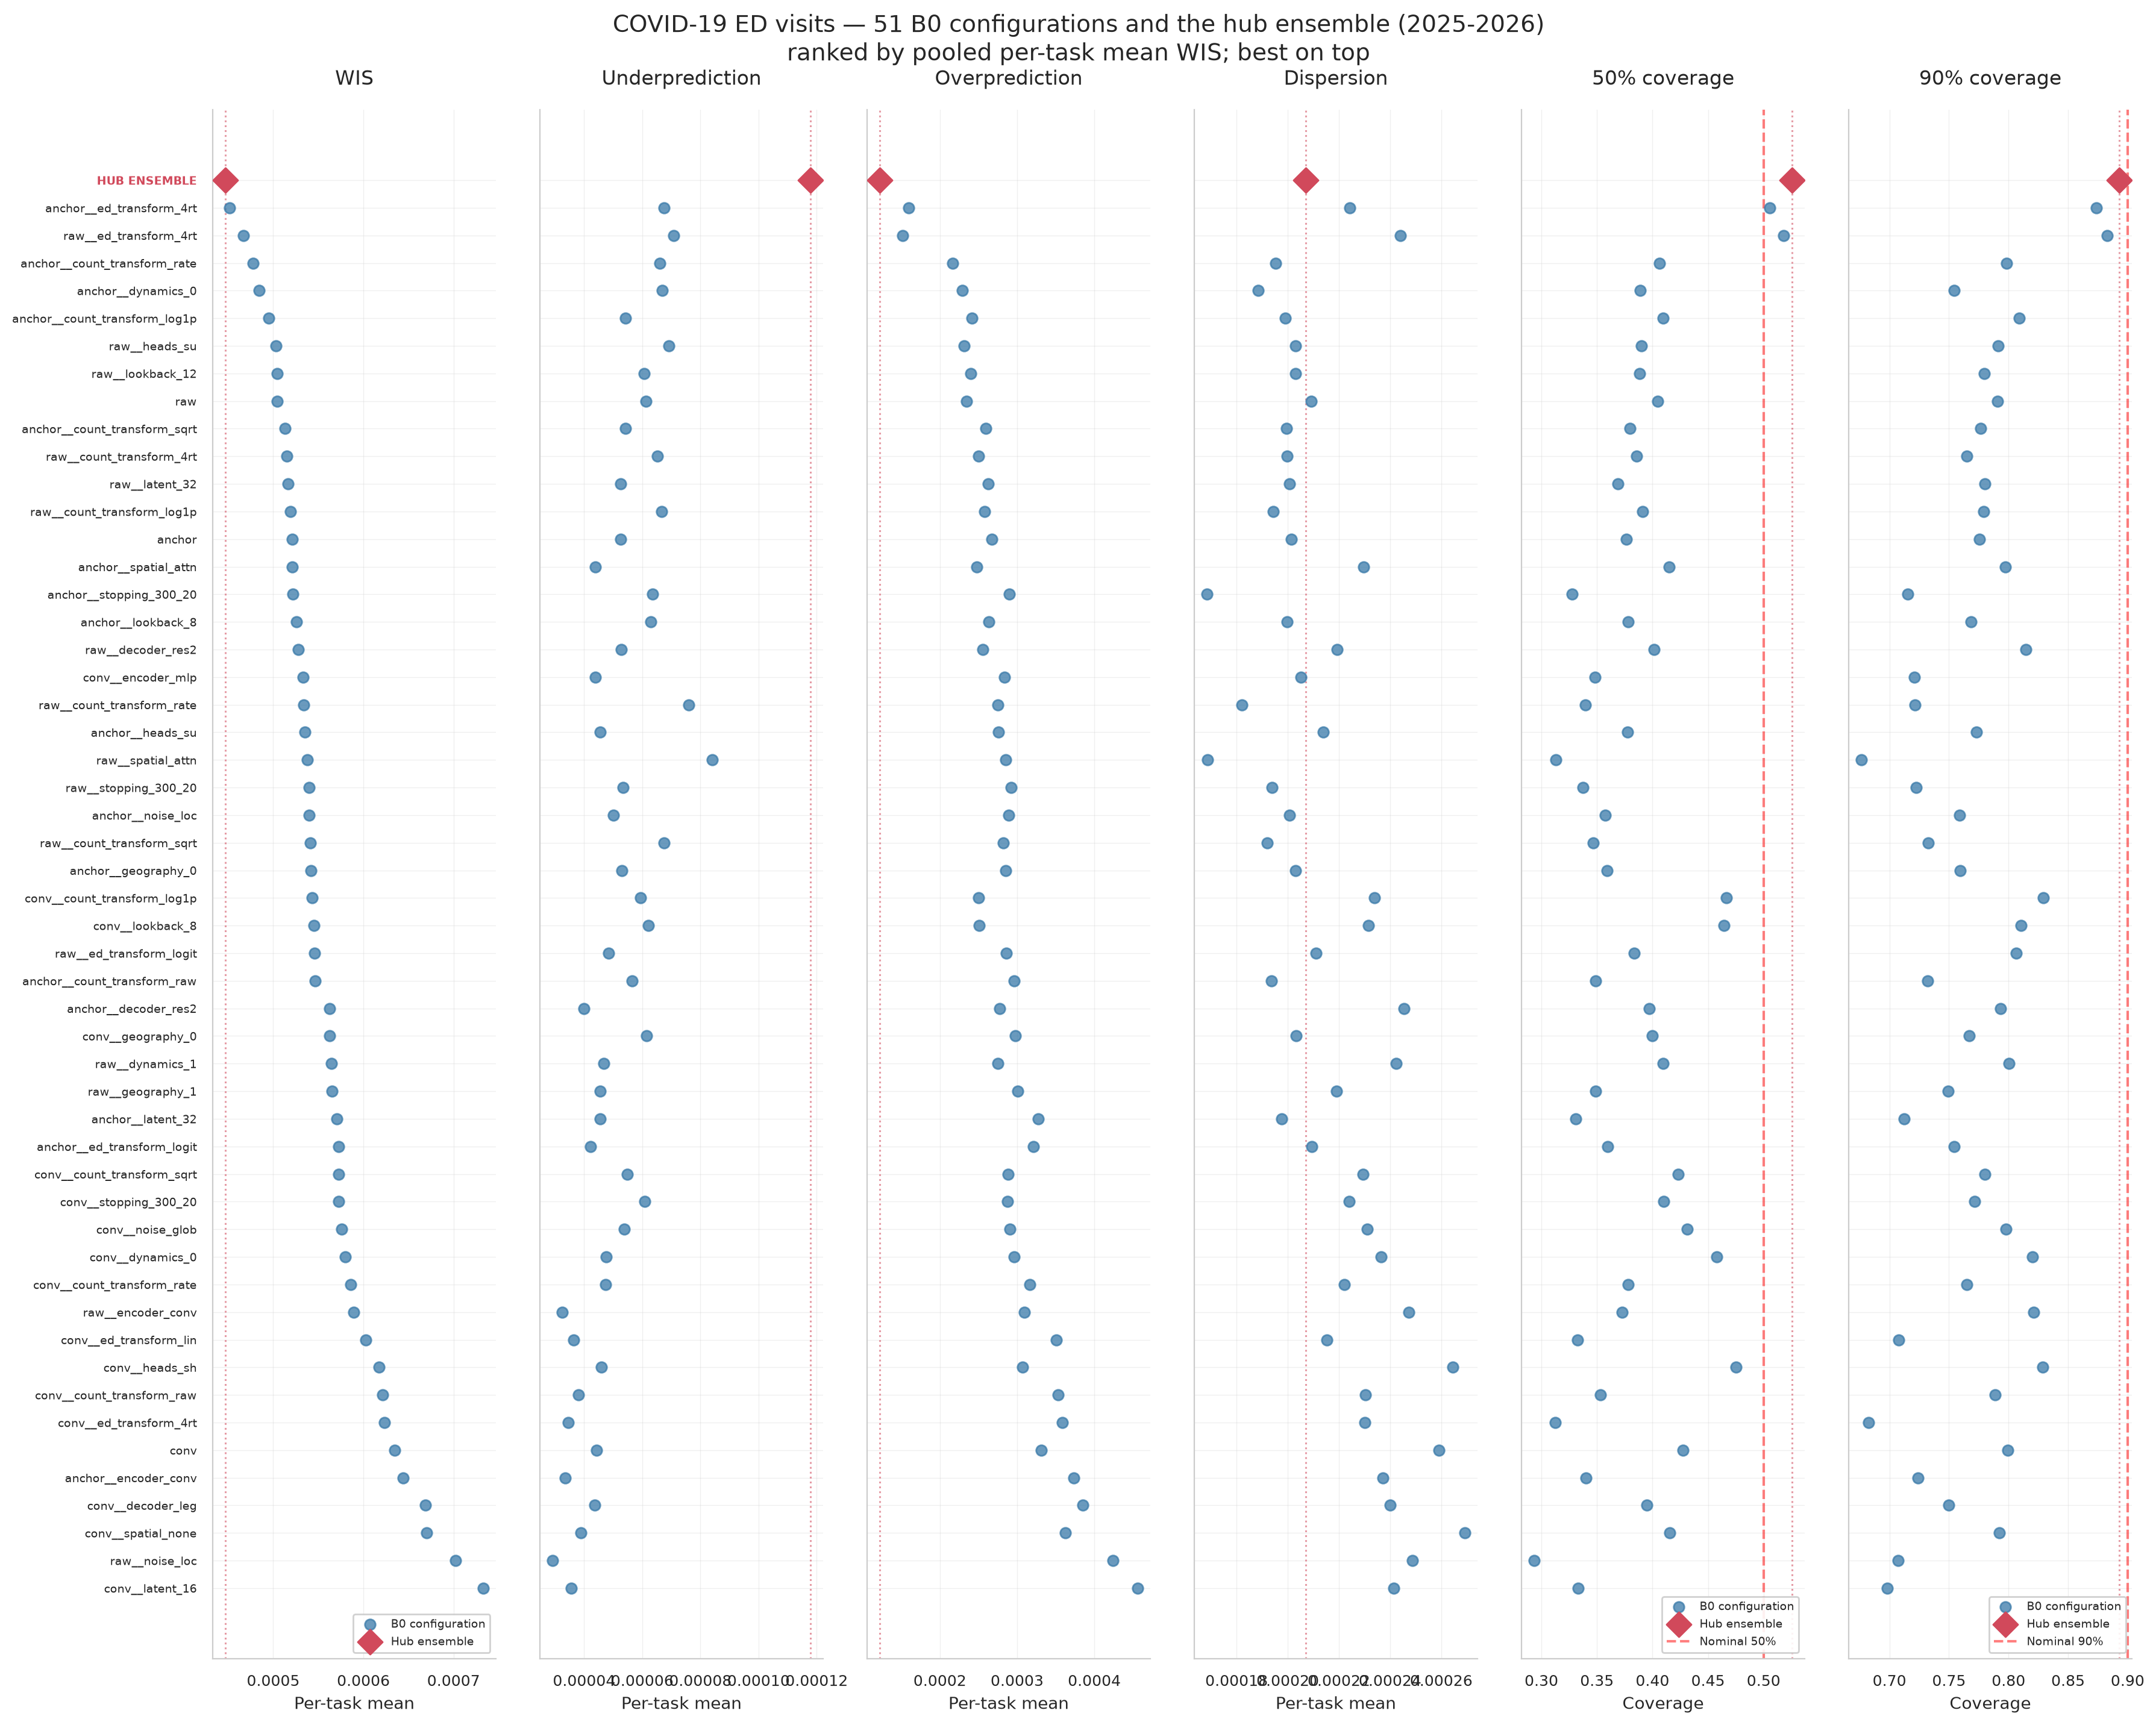
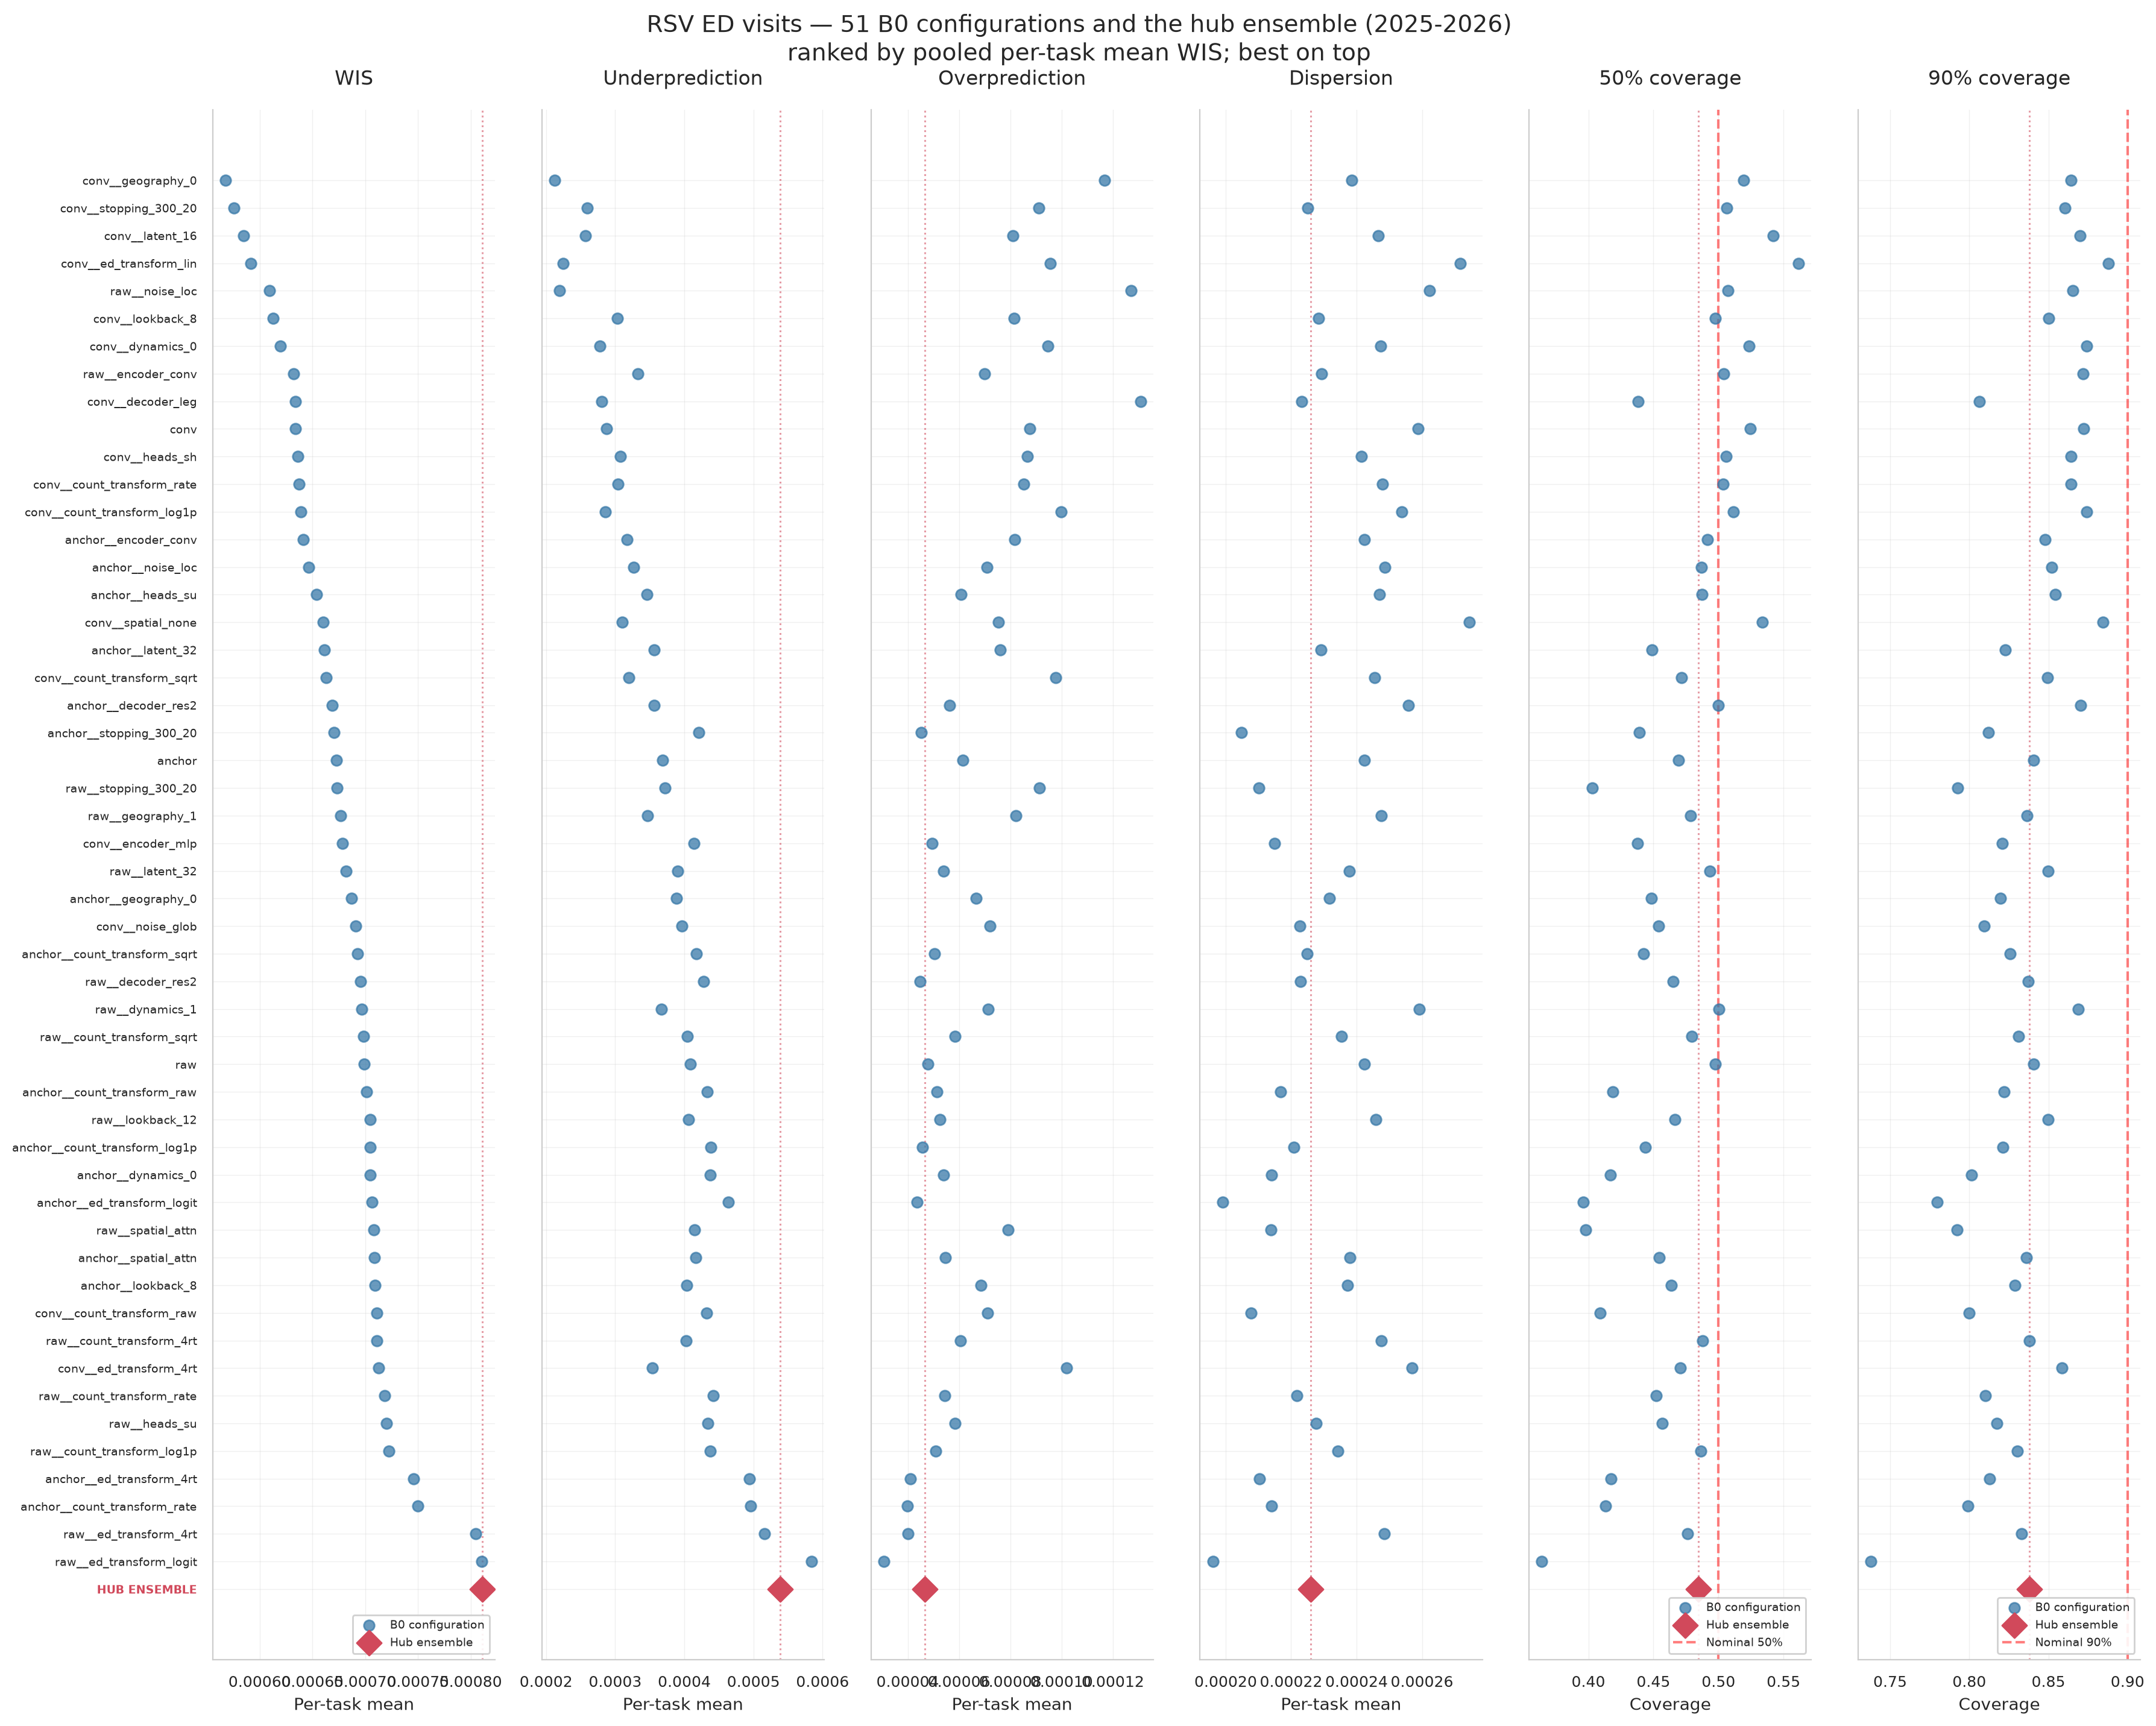
Where the ensemble falls among the 52 rows, by target:
| Target | Ensemble rank | Configurations beating it |
|---|---|---|
| Influenza admissions | 27 / 52 | 26 of 51 |
| COVID-19 admissions | 27 / 52 | 26 of 51 |
| RSV admissions | 33 / 52 | 32 of 51 |
| Influenza ED visits | 37 / 52 | 36 of 51 |
| COVID-19 ED visits | 1 / 52 | 0 of 51 |
| RSV ED visits | 52 / 52 | 51 of 51 |
The two extremes are the clearest signals here: no configuration beats the ensemble on COVID-19 ED visits, and every configuration beats it on RSV ED visits. The coverage columns show the calibration defect directly — nearly every dot sits left of both nominal lines.
This ordering is not the selection score
These figures rank by pooled per-task mean WIS within a target, which
weights a season by how many tasks it contributes. The selection score in
the table above instead averages season ratios equally, then weights
admissions twice ED. The two orderings therefore differ — on influenza
admissions this figure puts anchor__stopping_300_20 first, while the
selection score puts conv__heads_sh first. Neither is wrong; they answer
different questions.
Fan plots¶
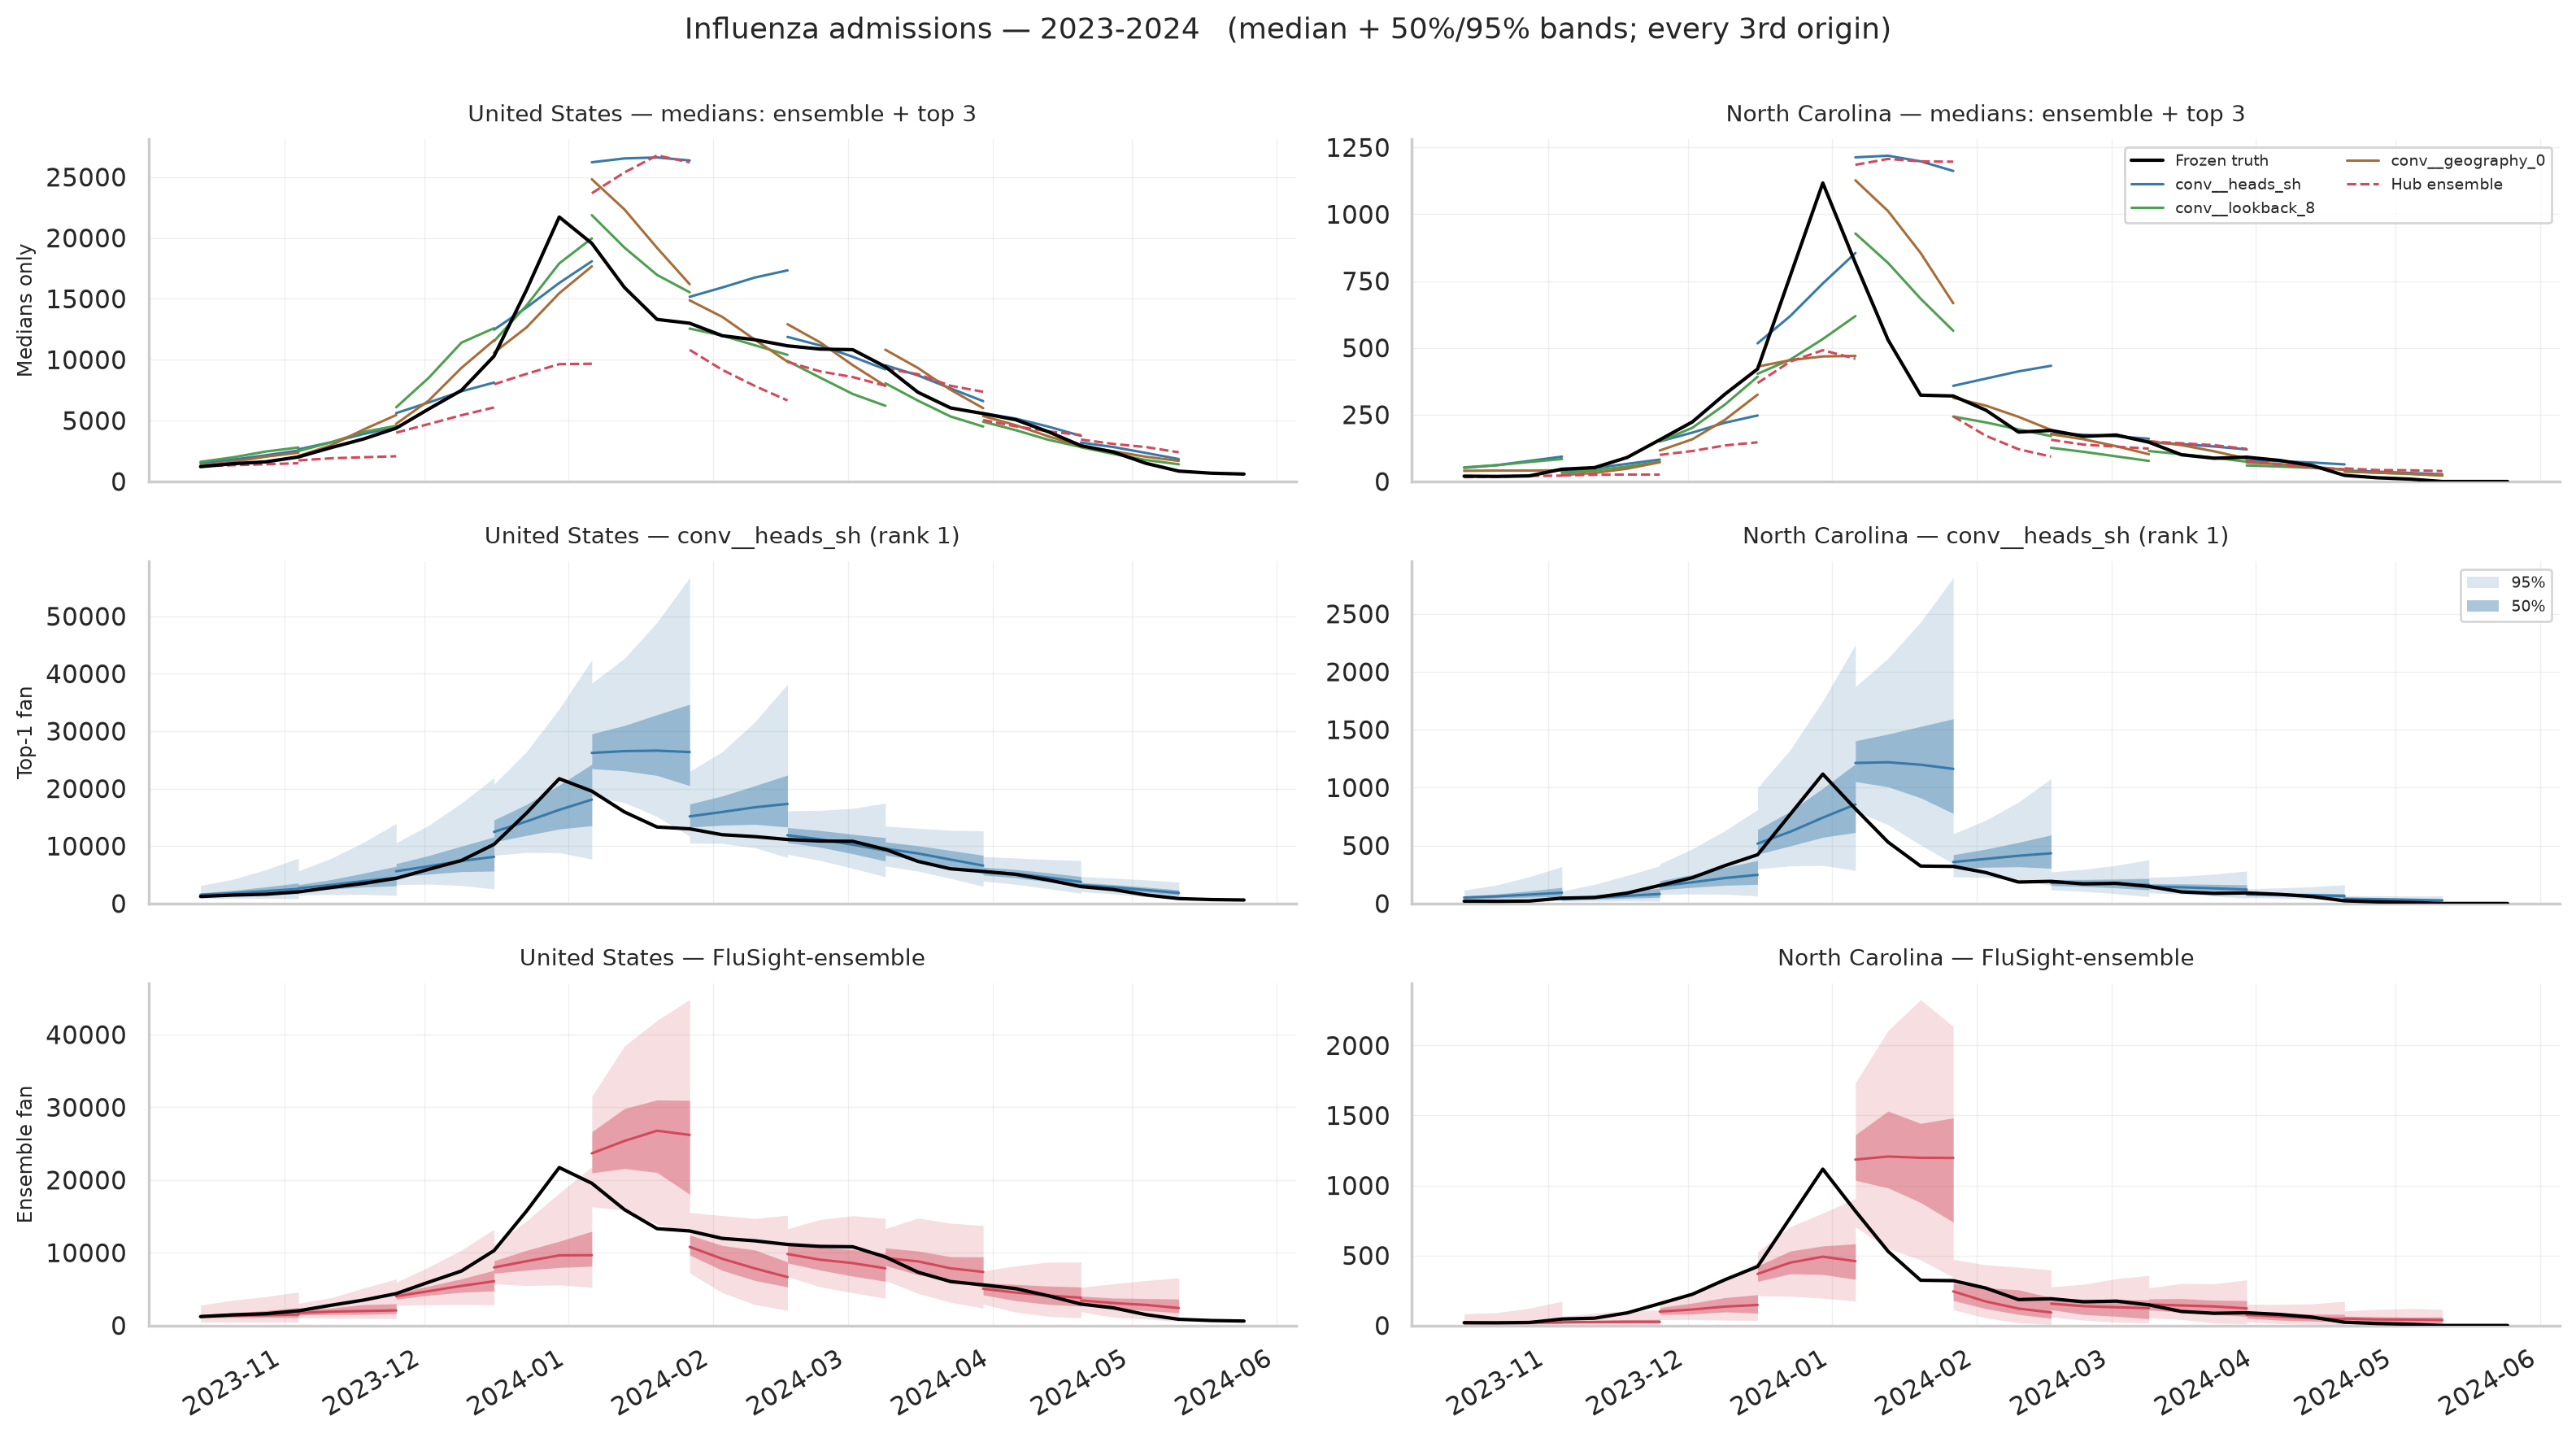
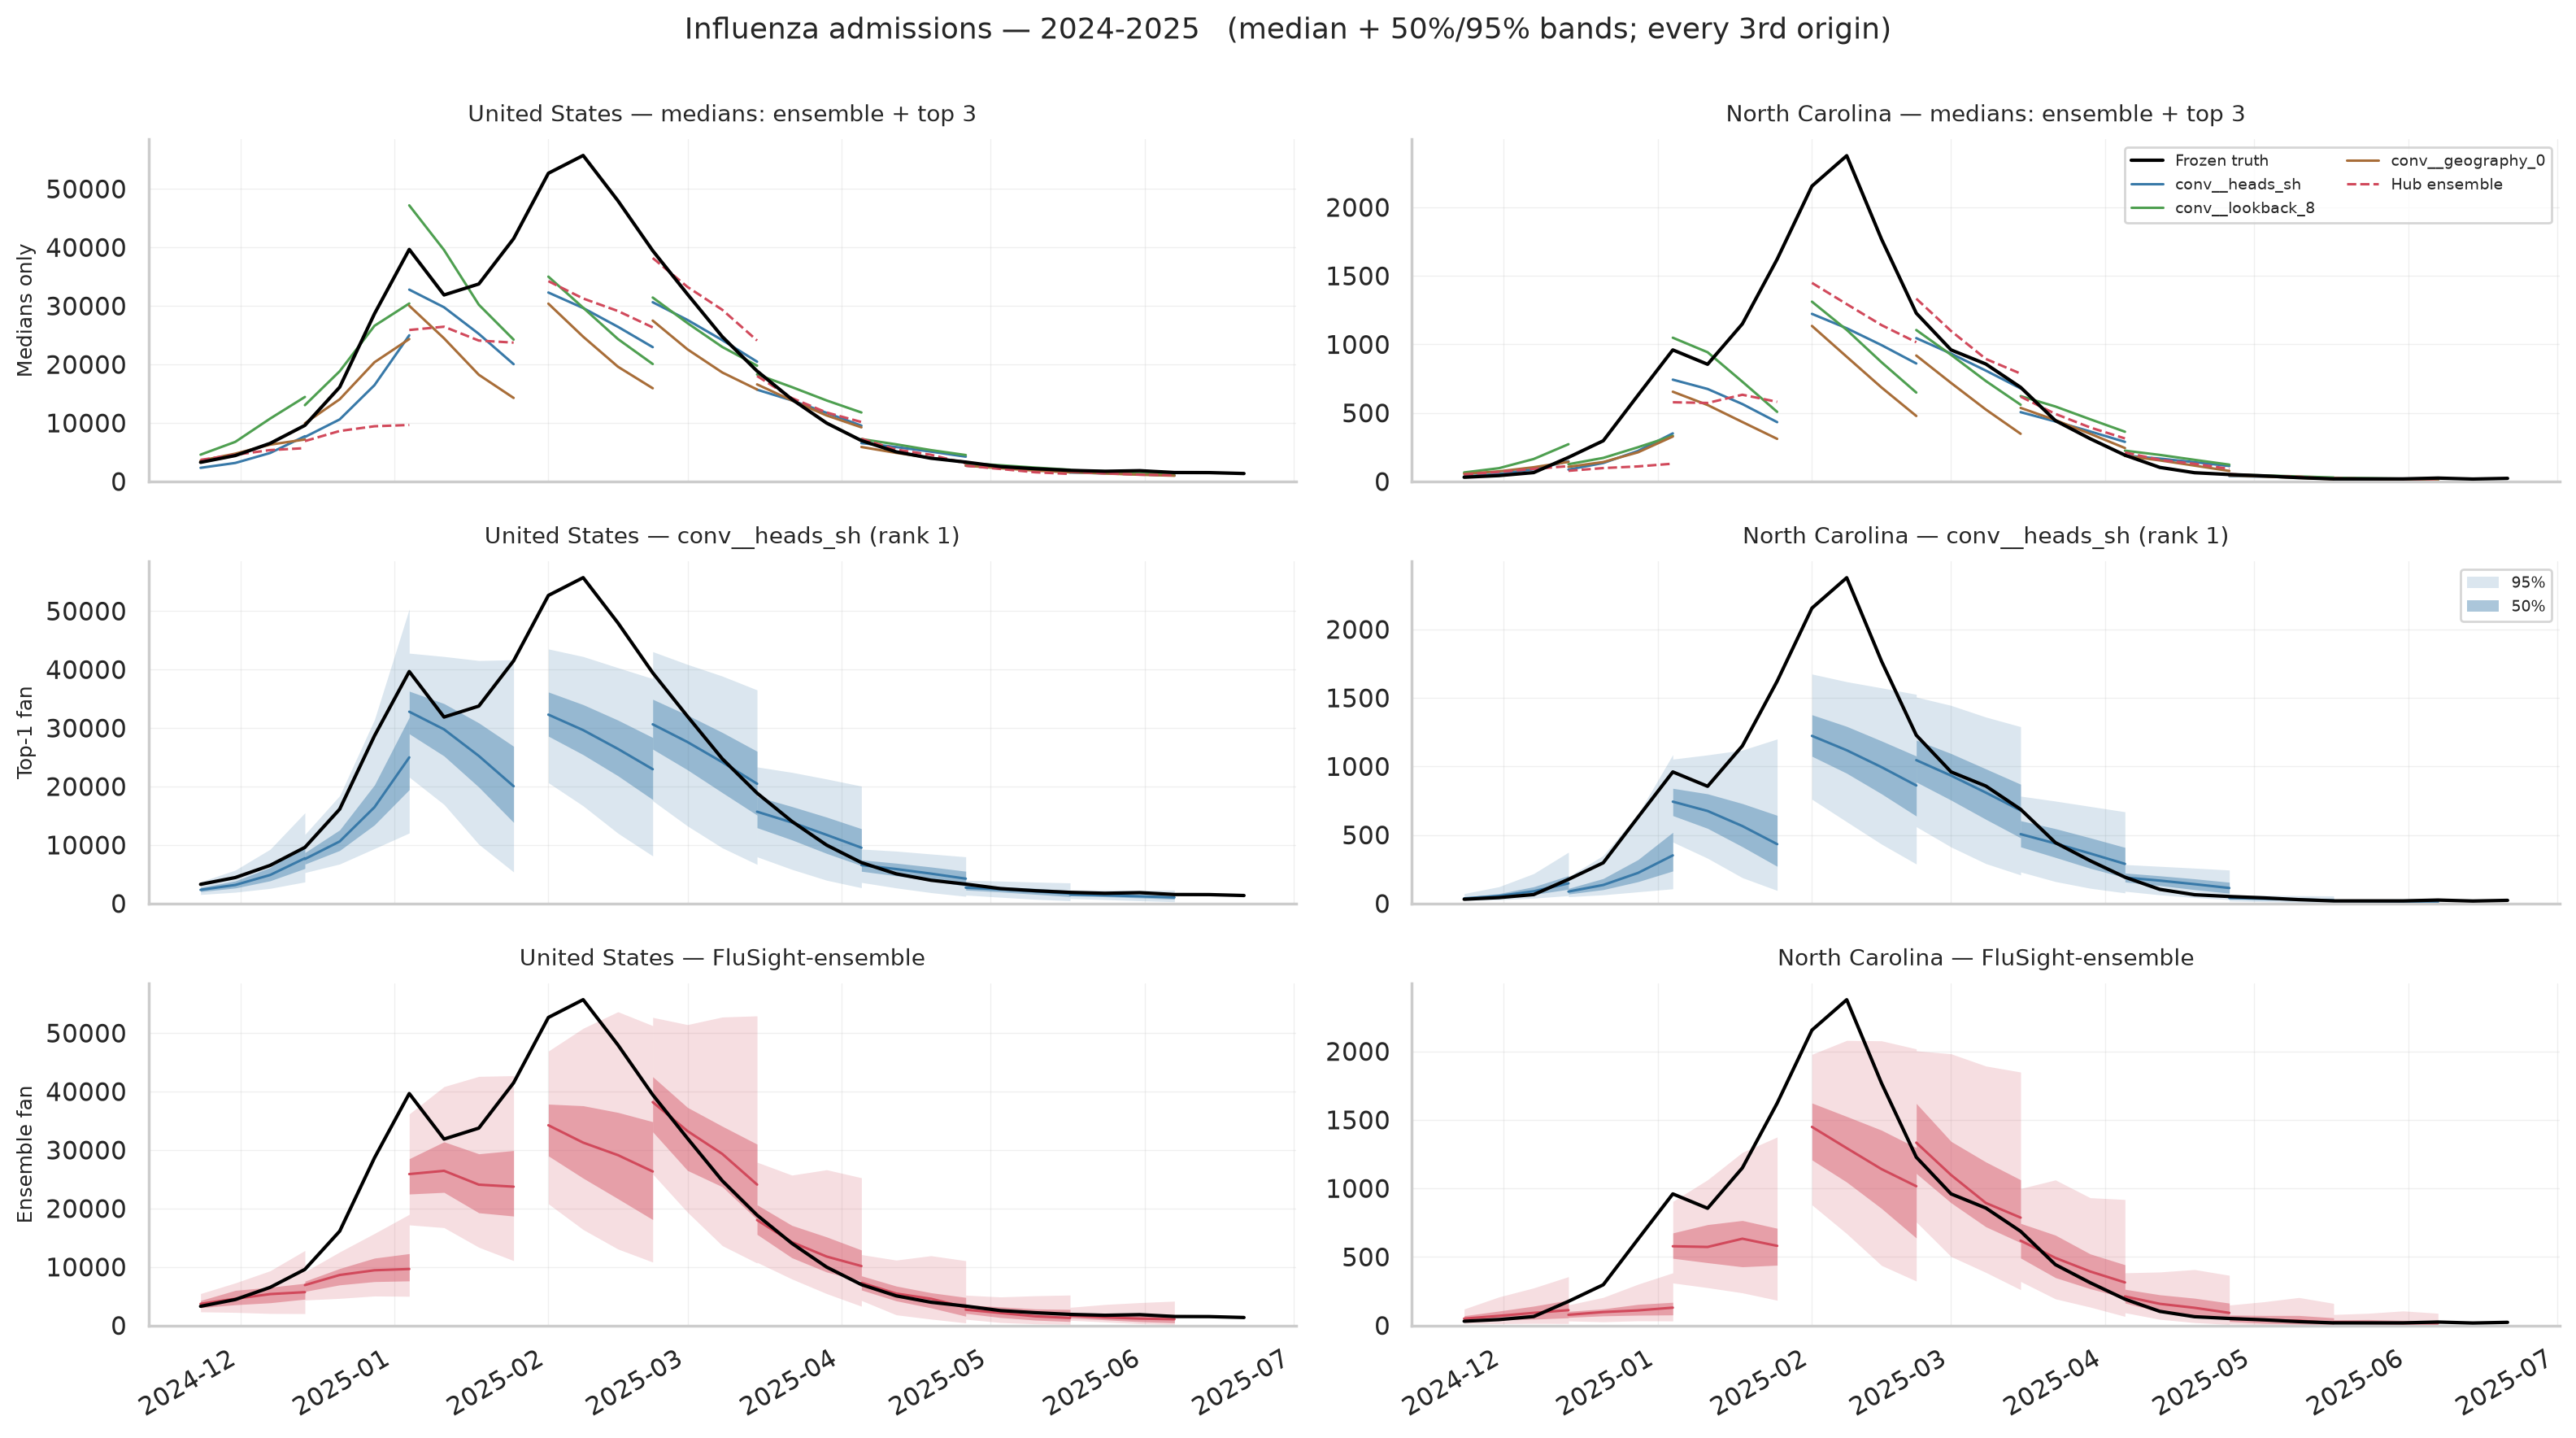
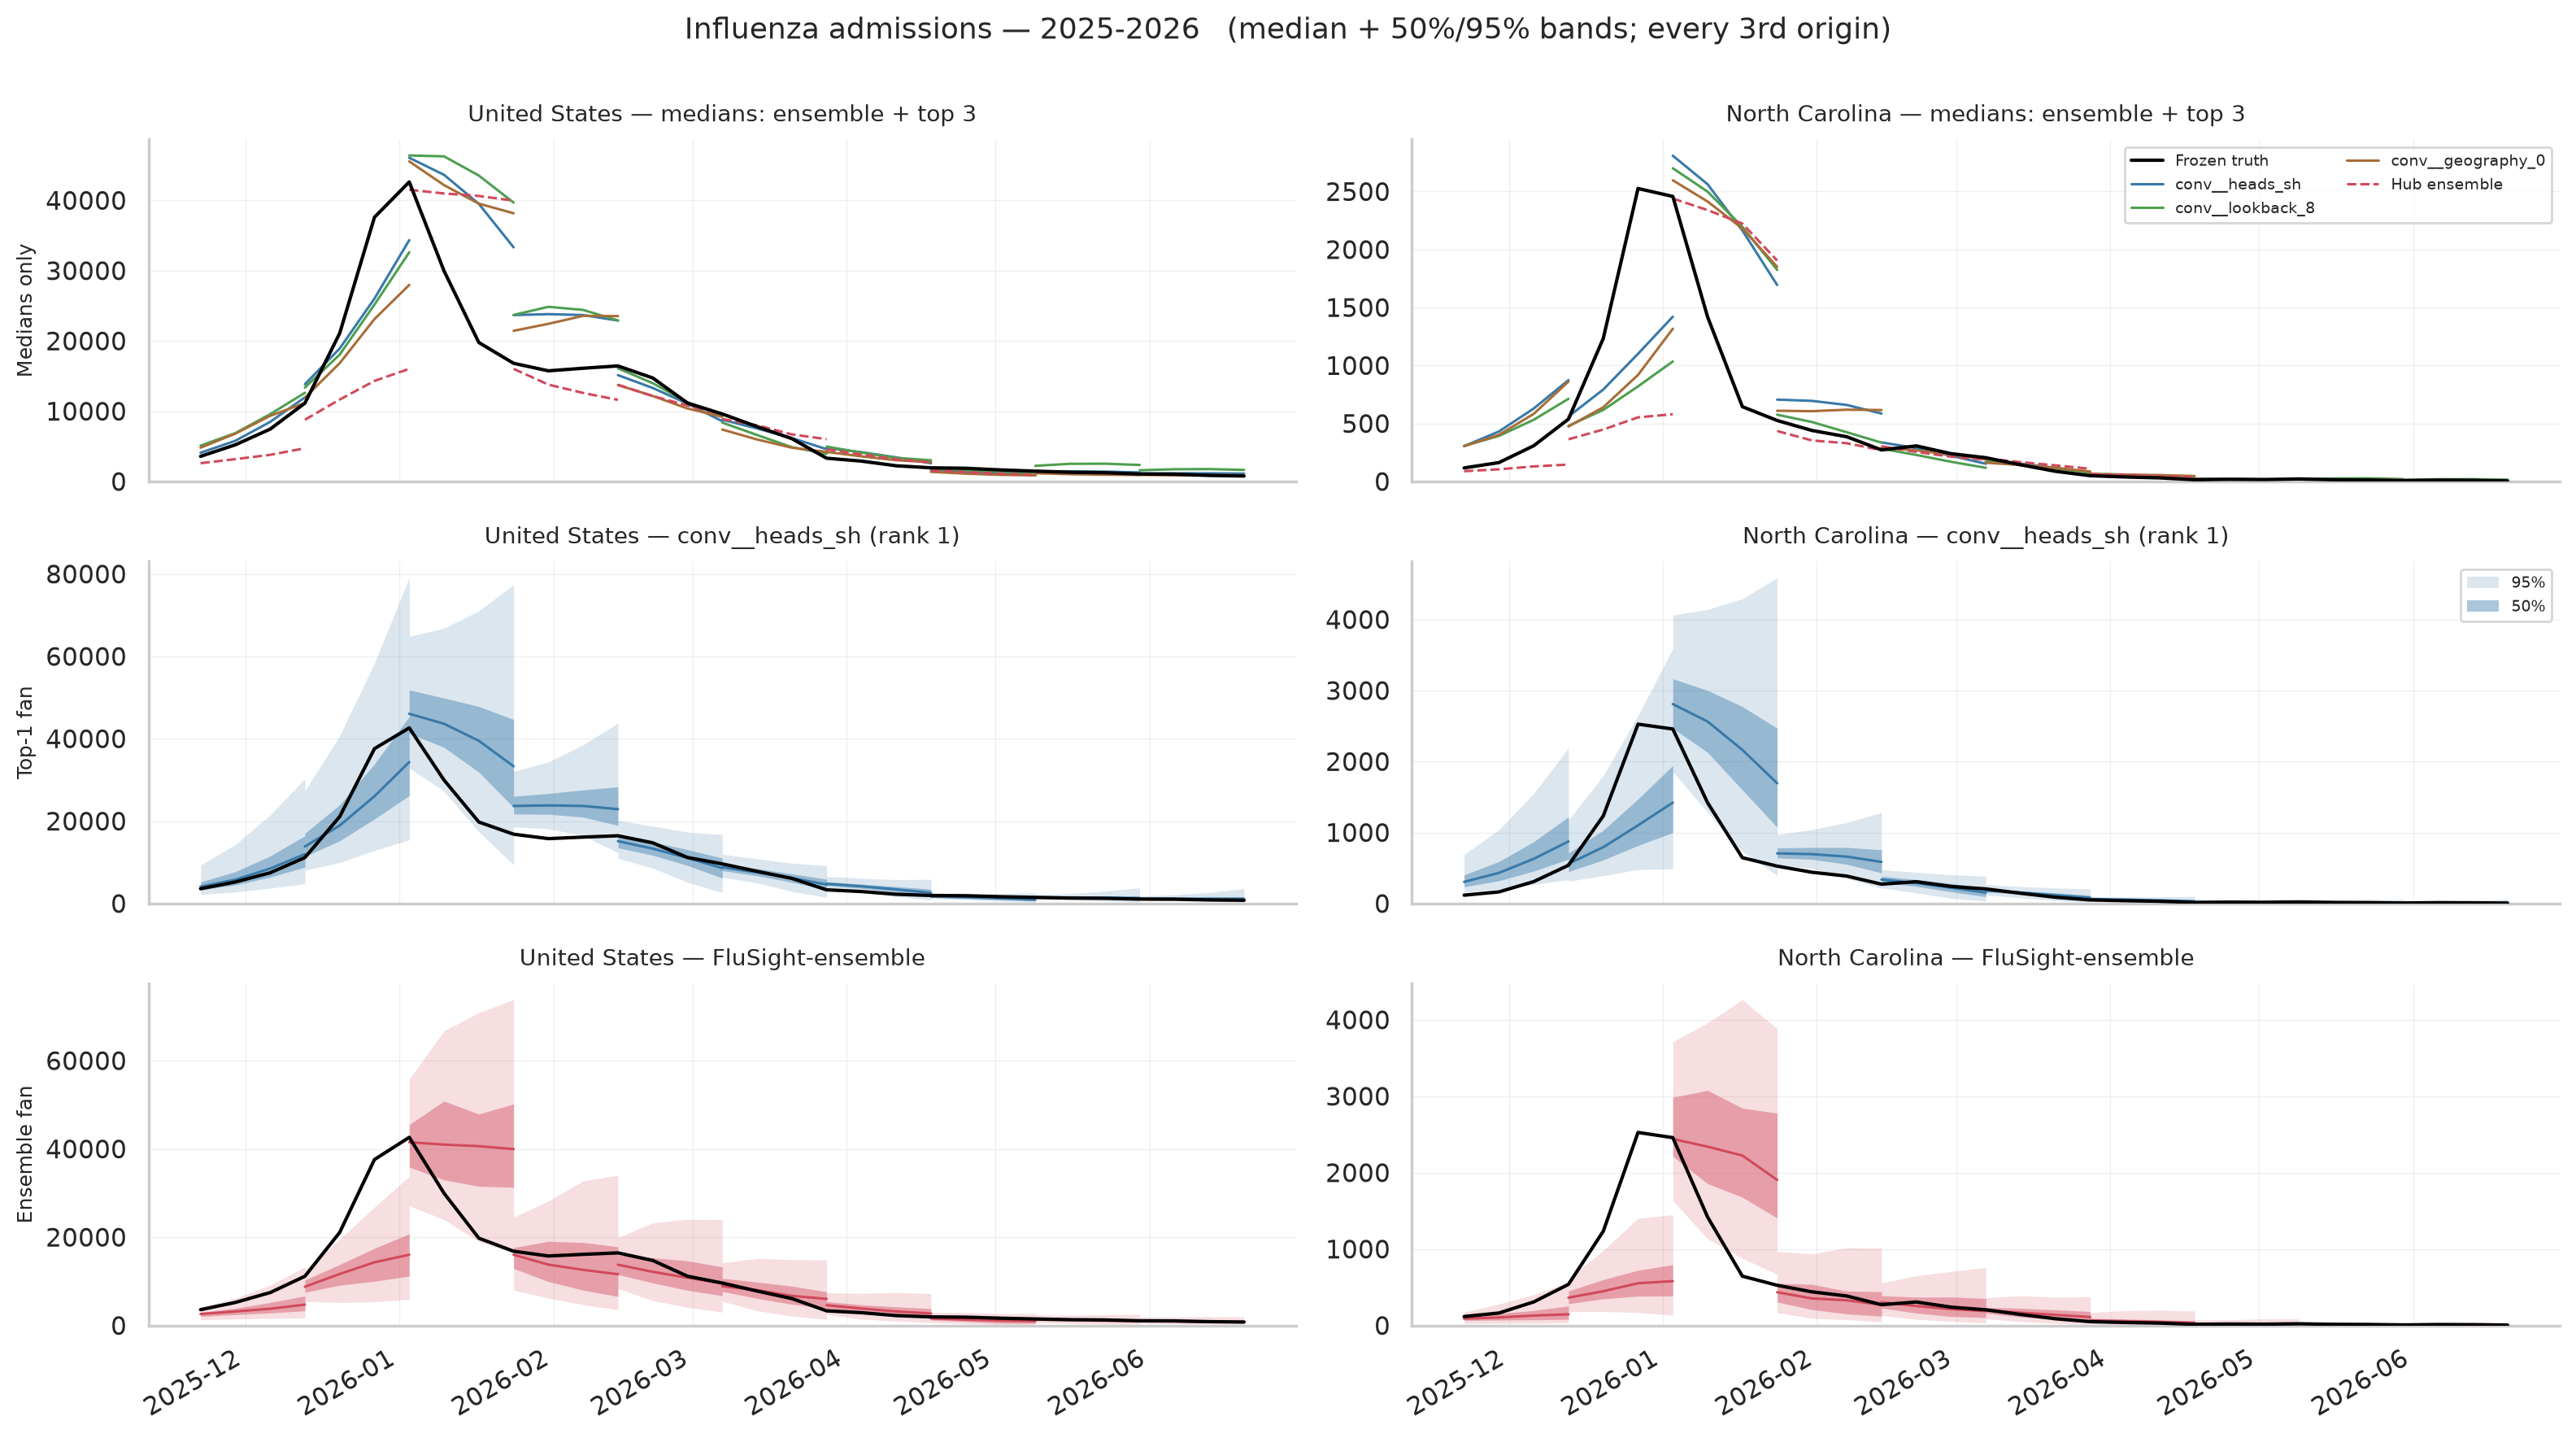
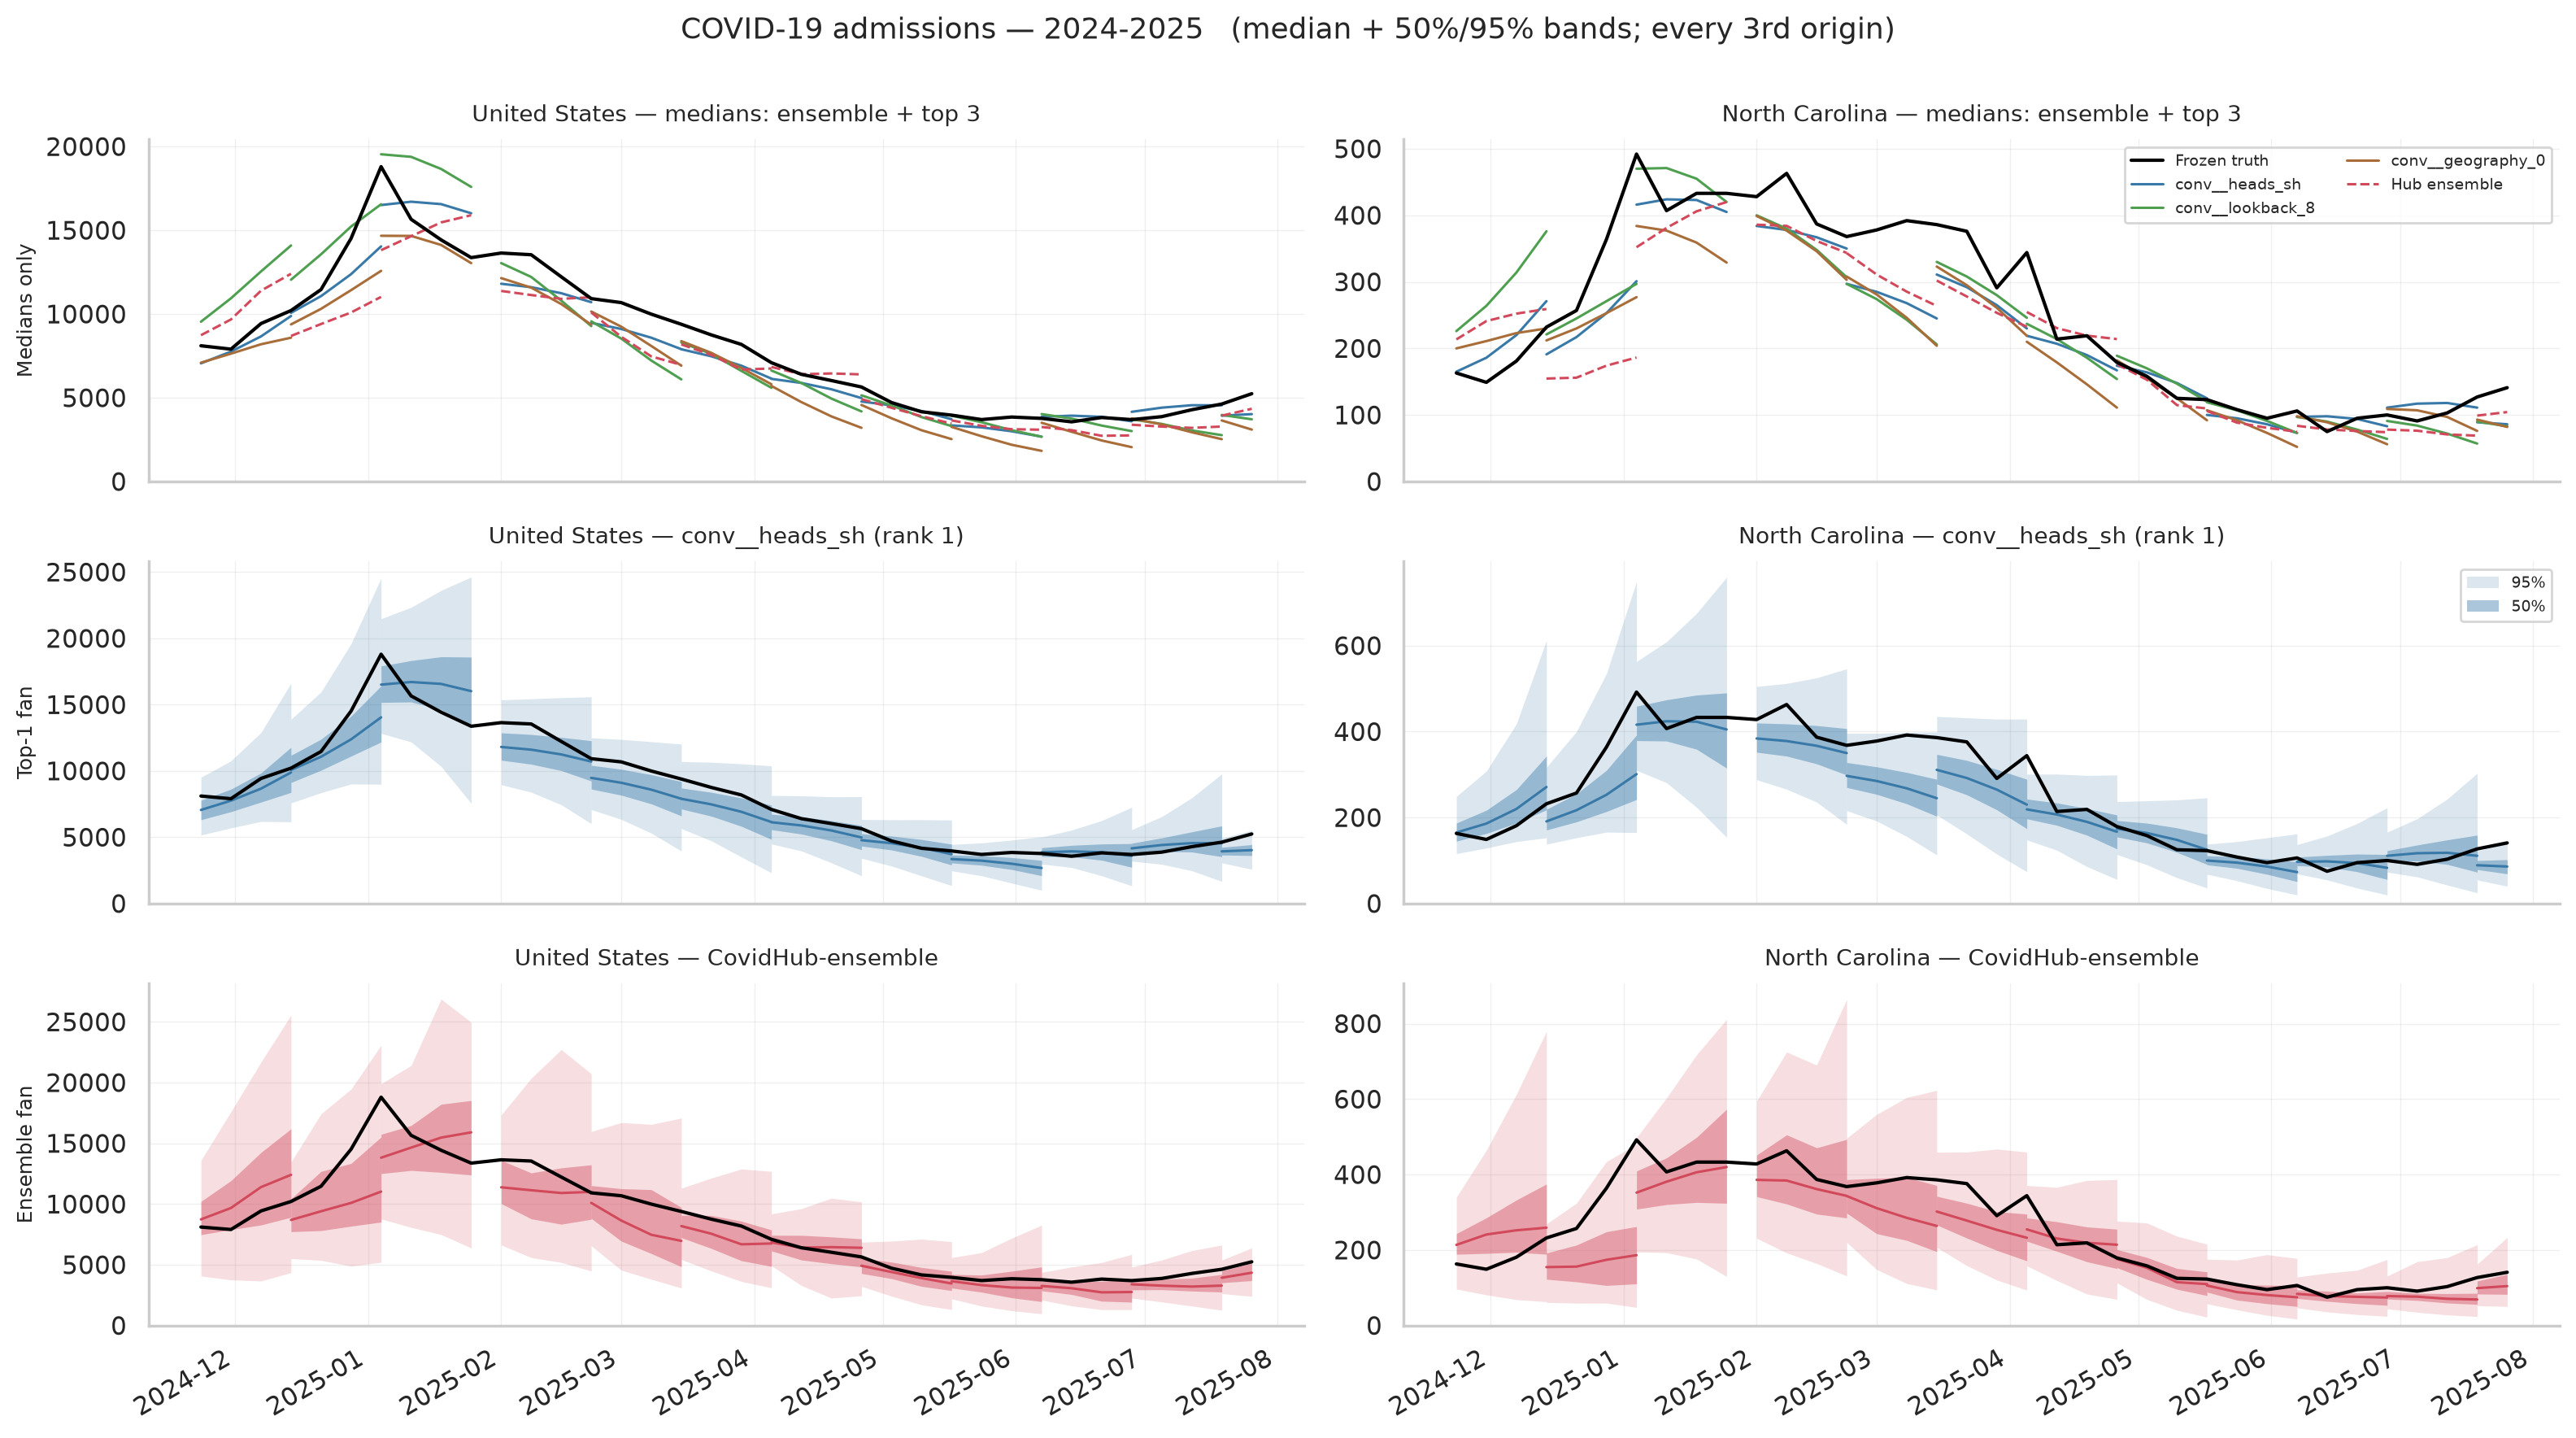
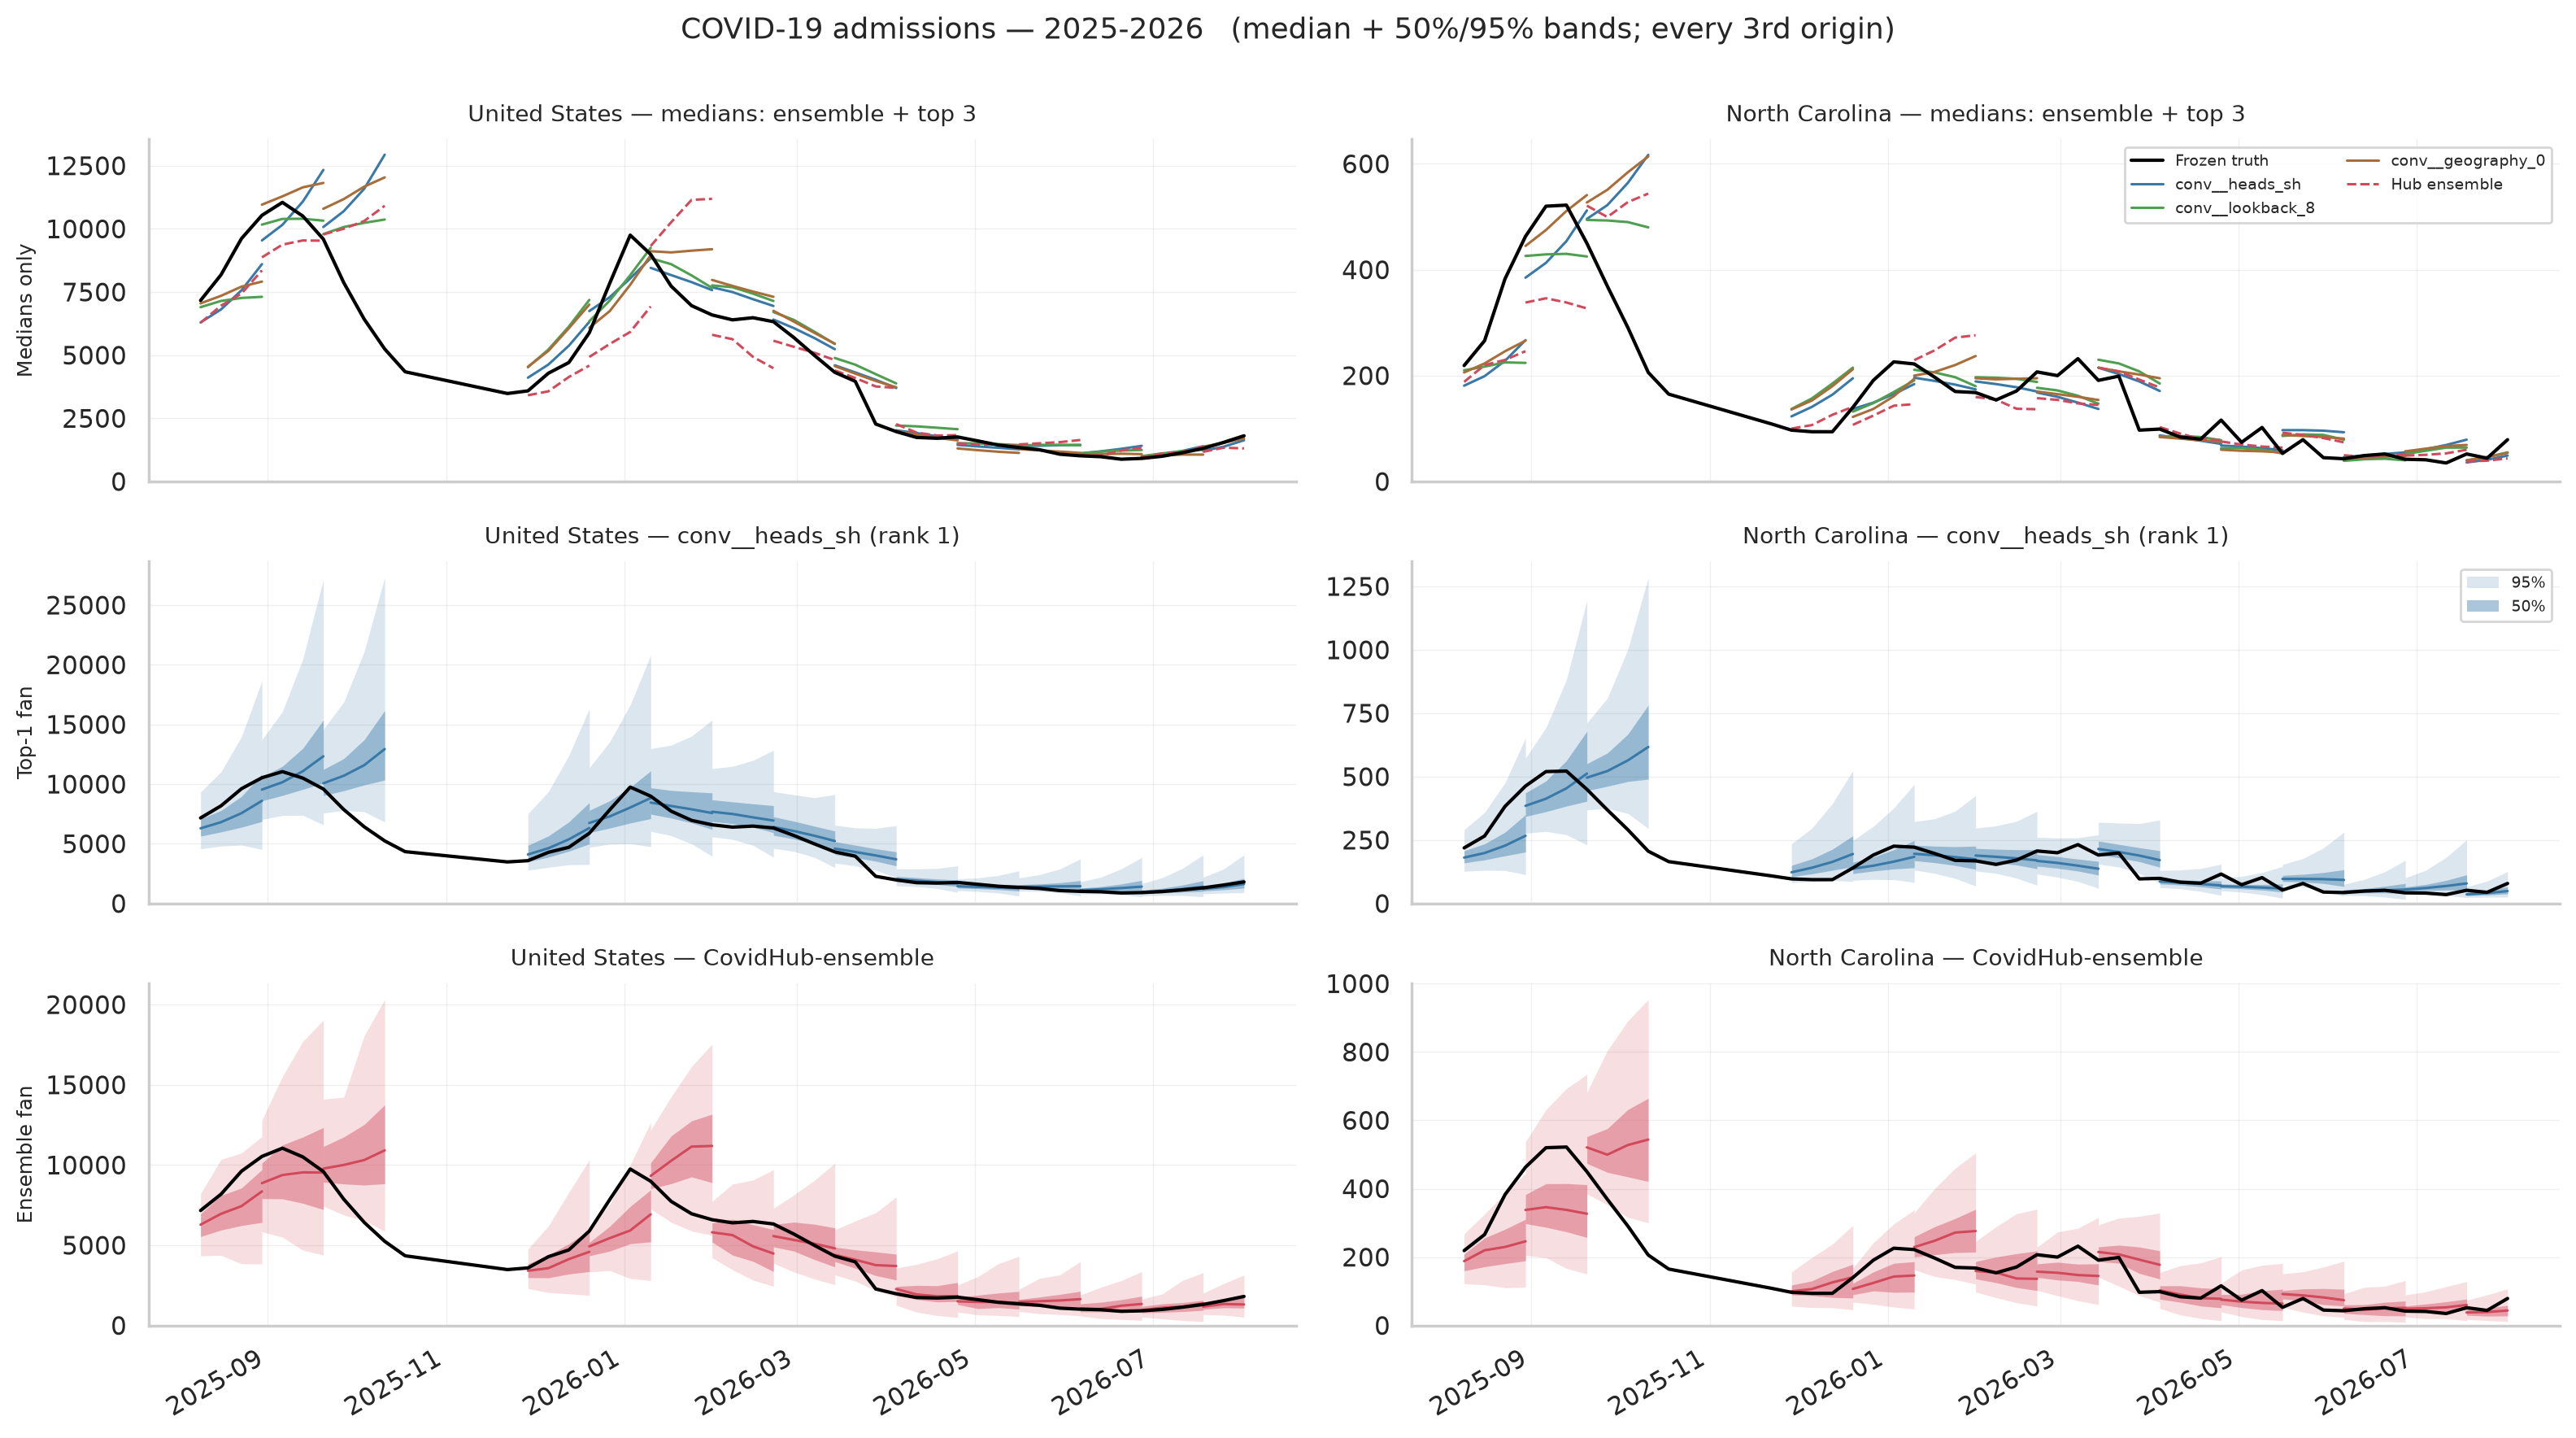
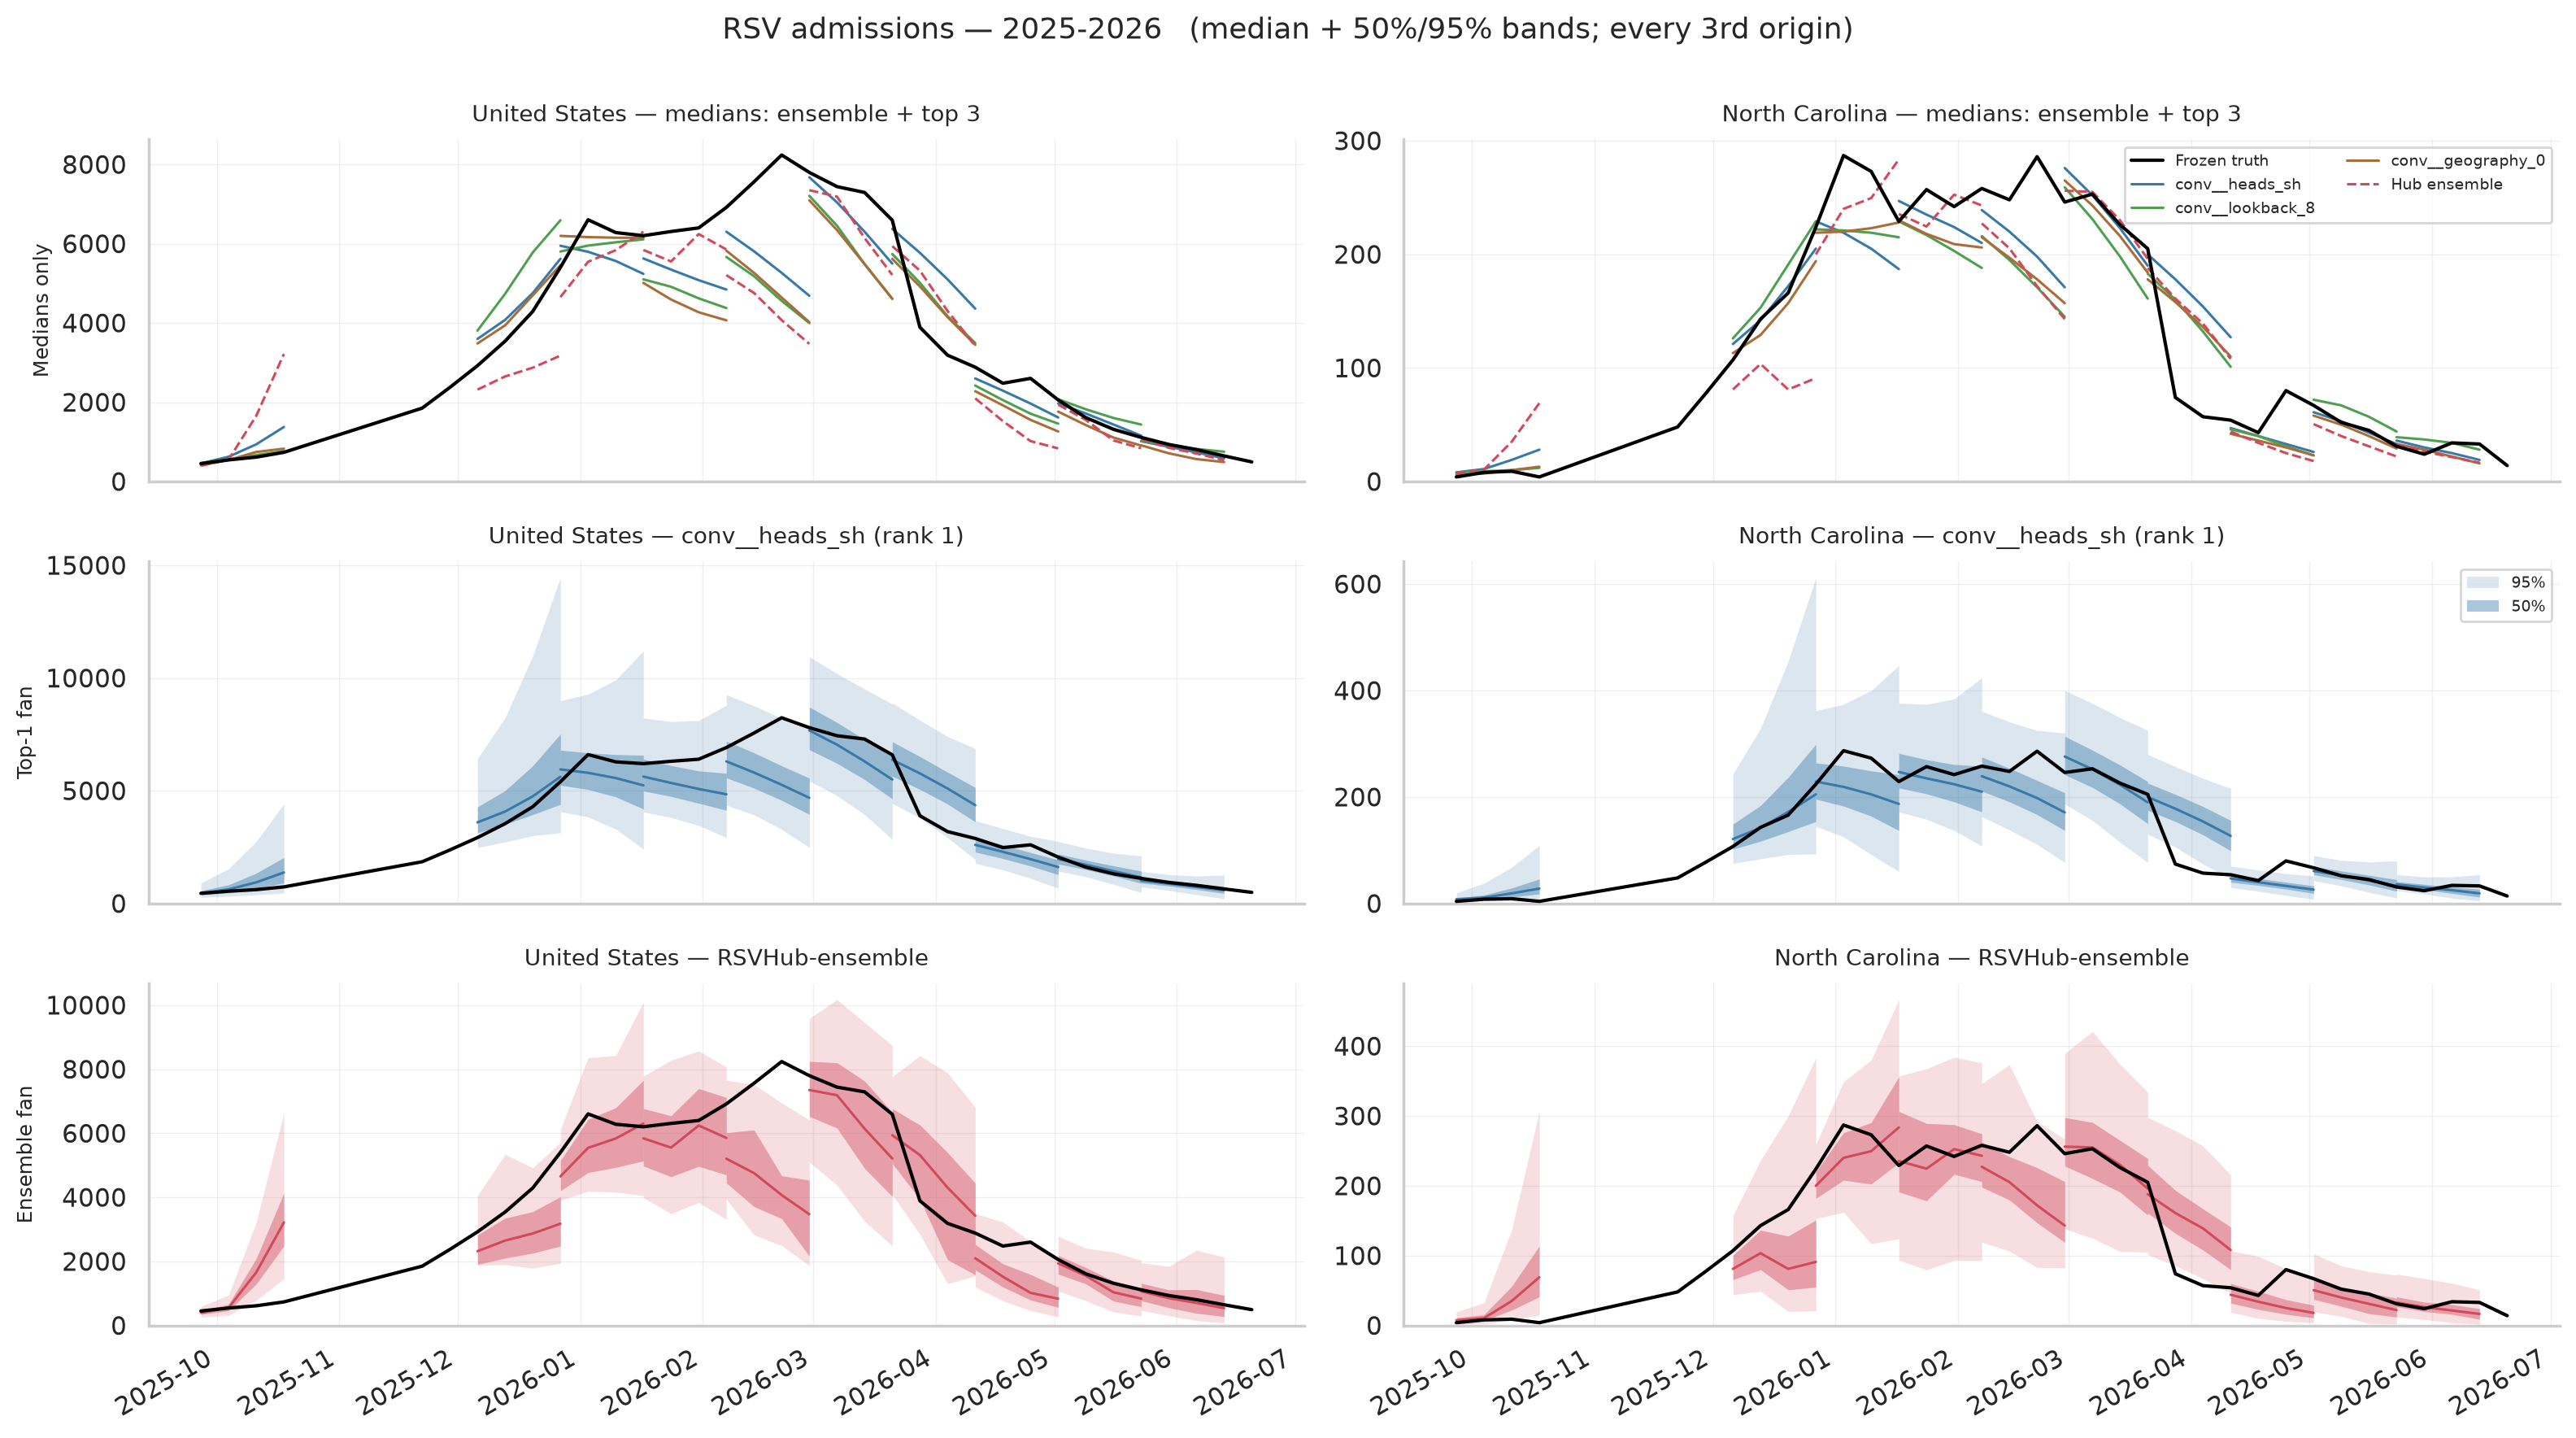
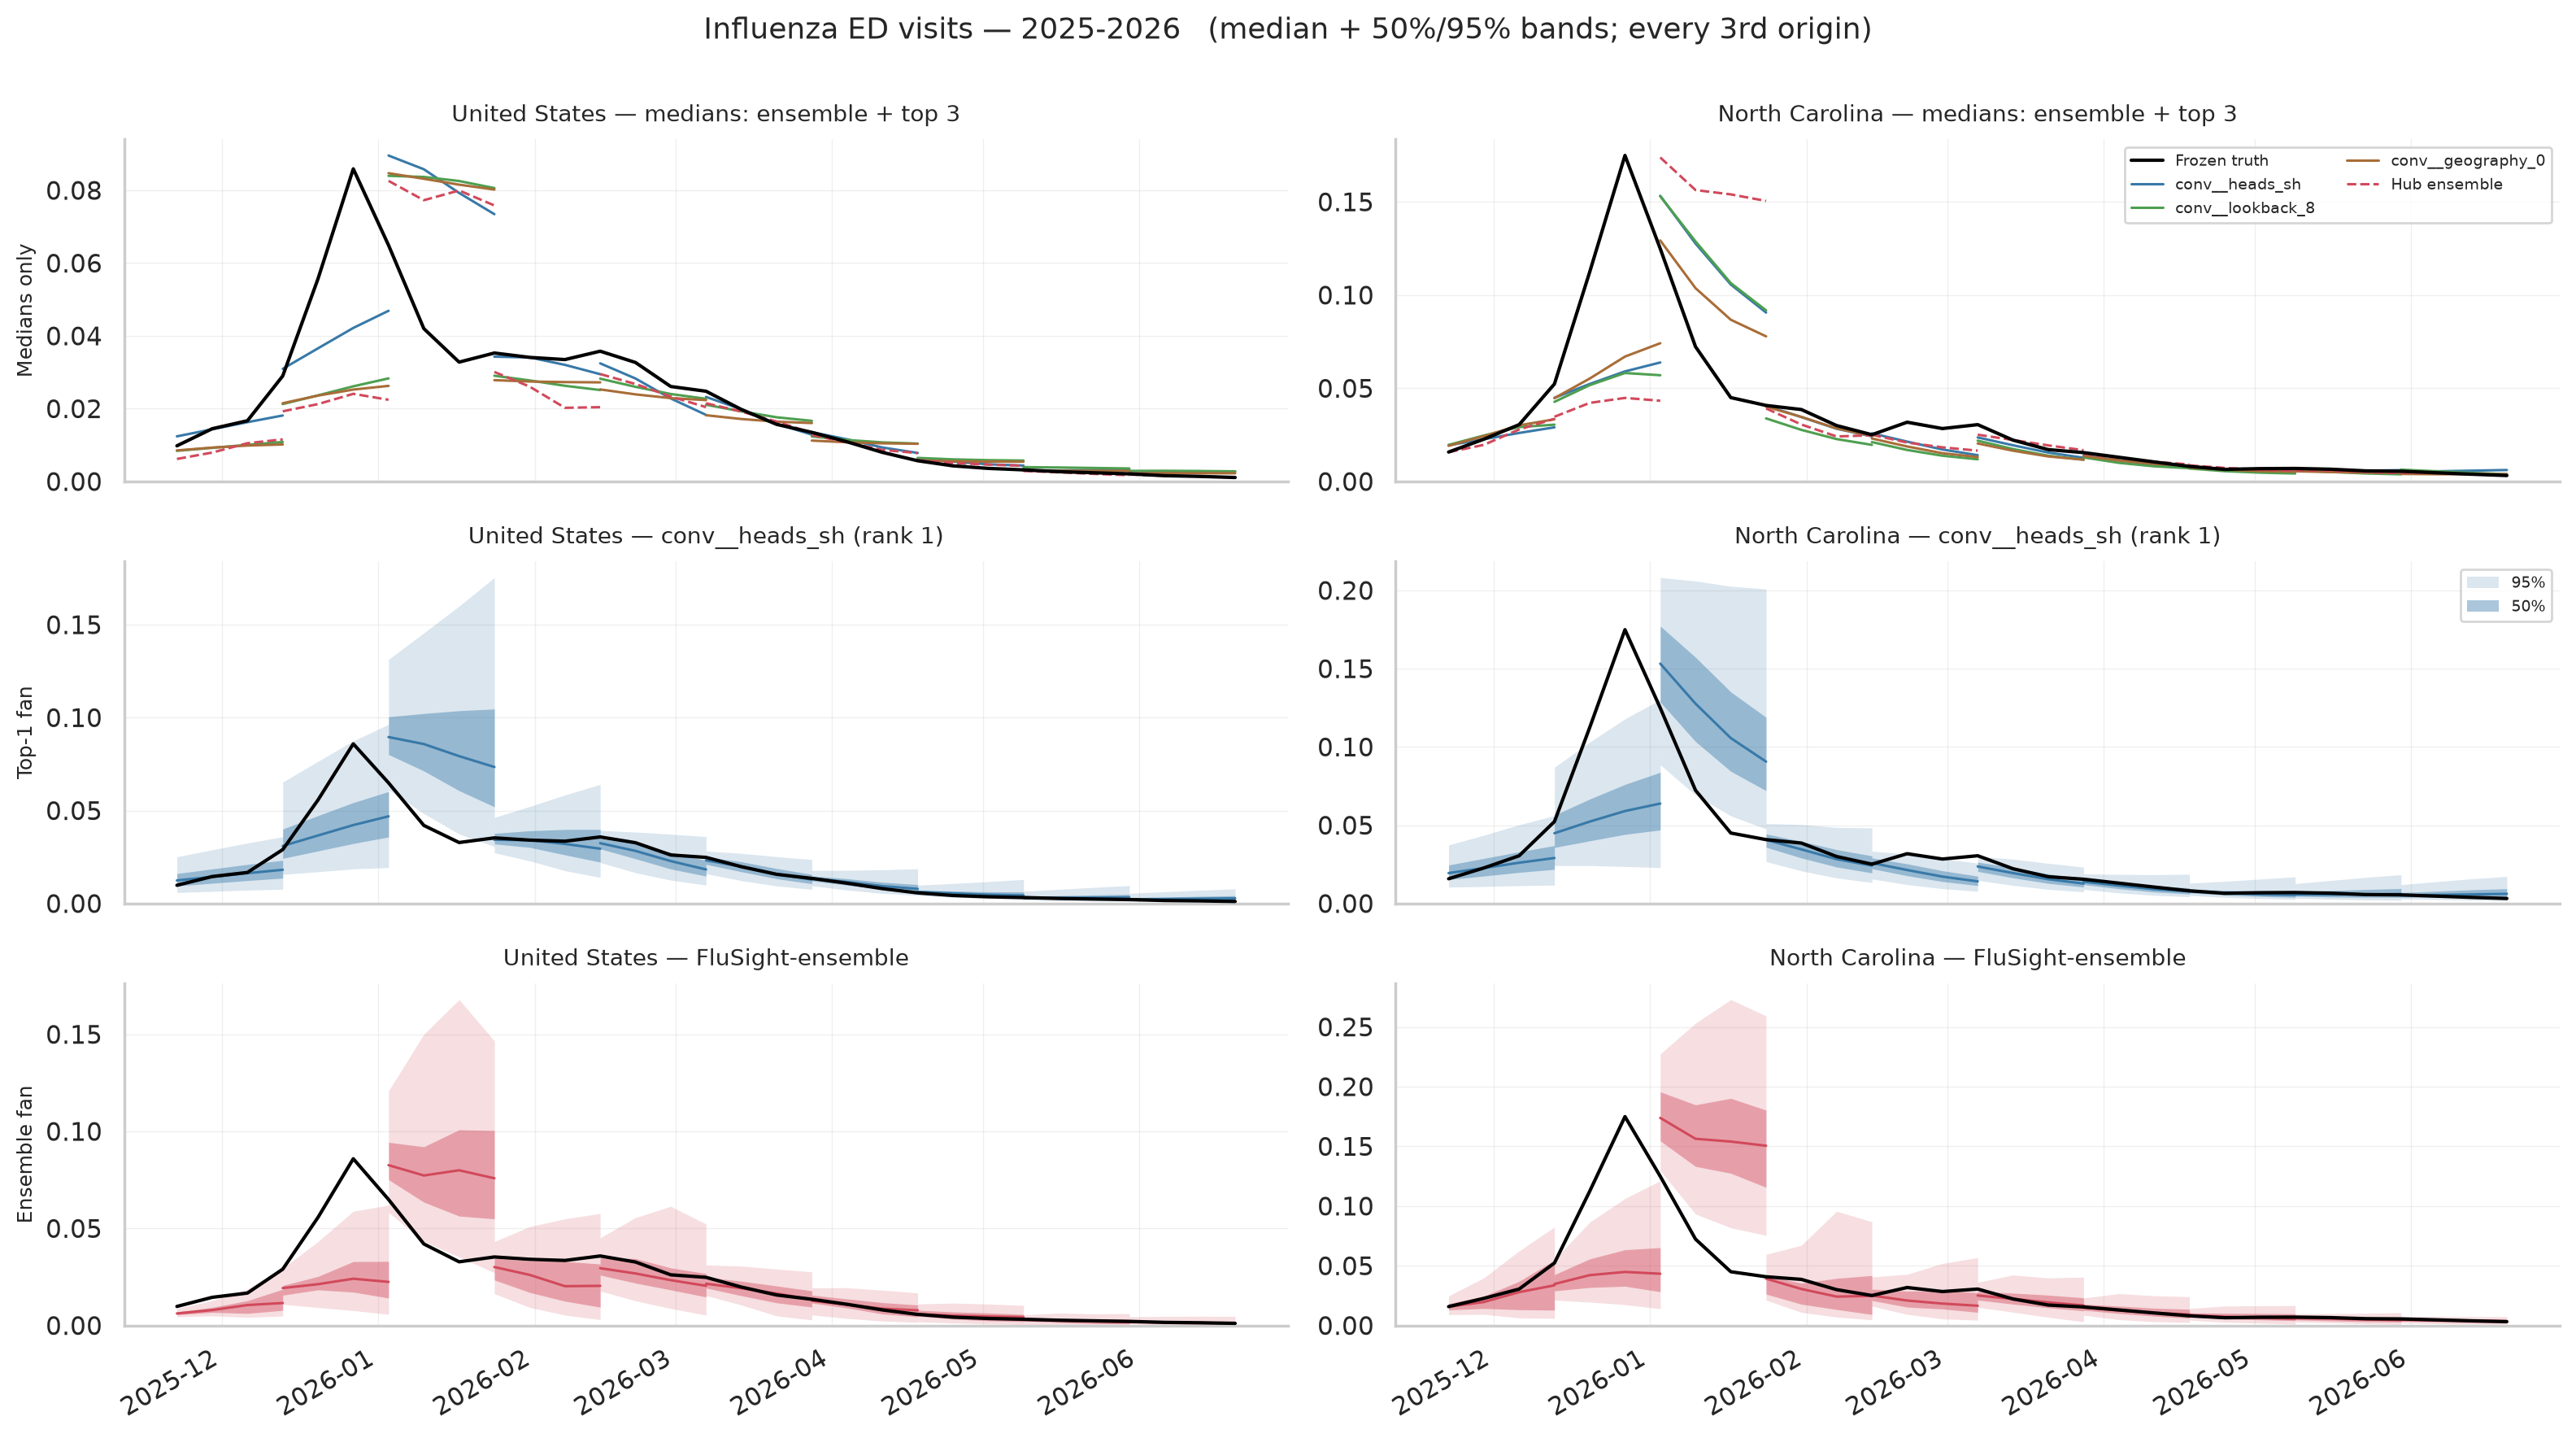
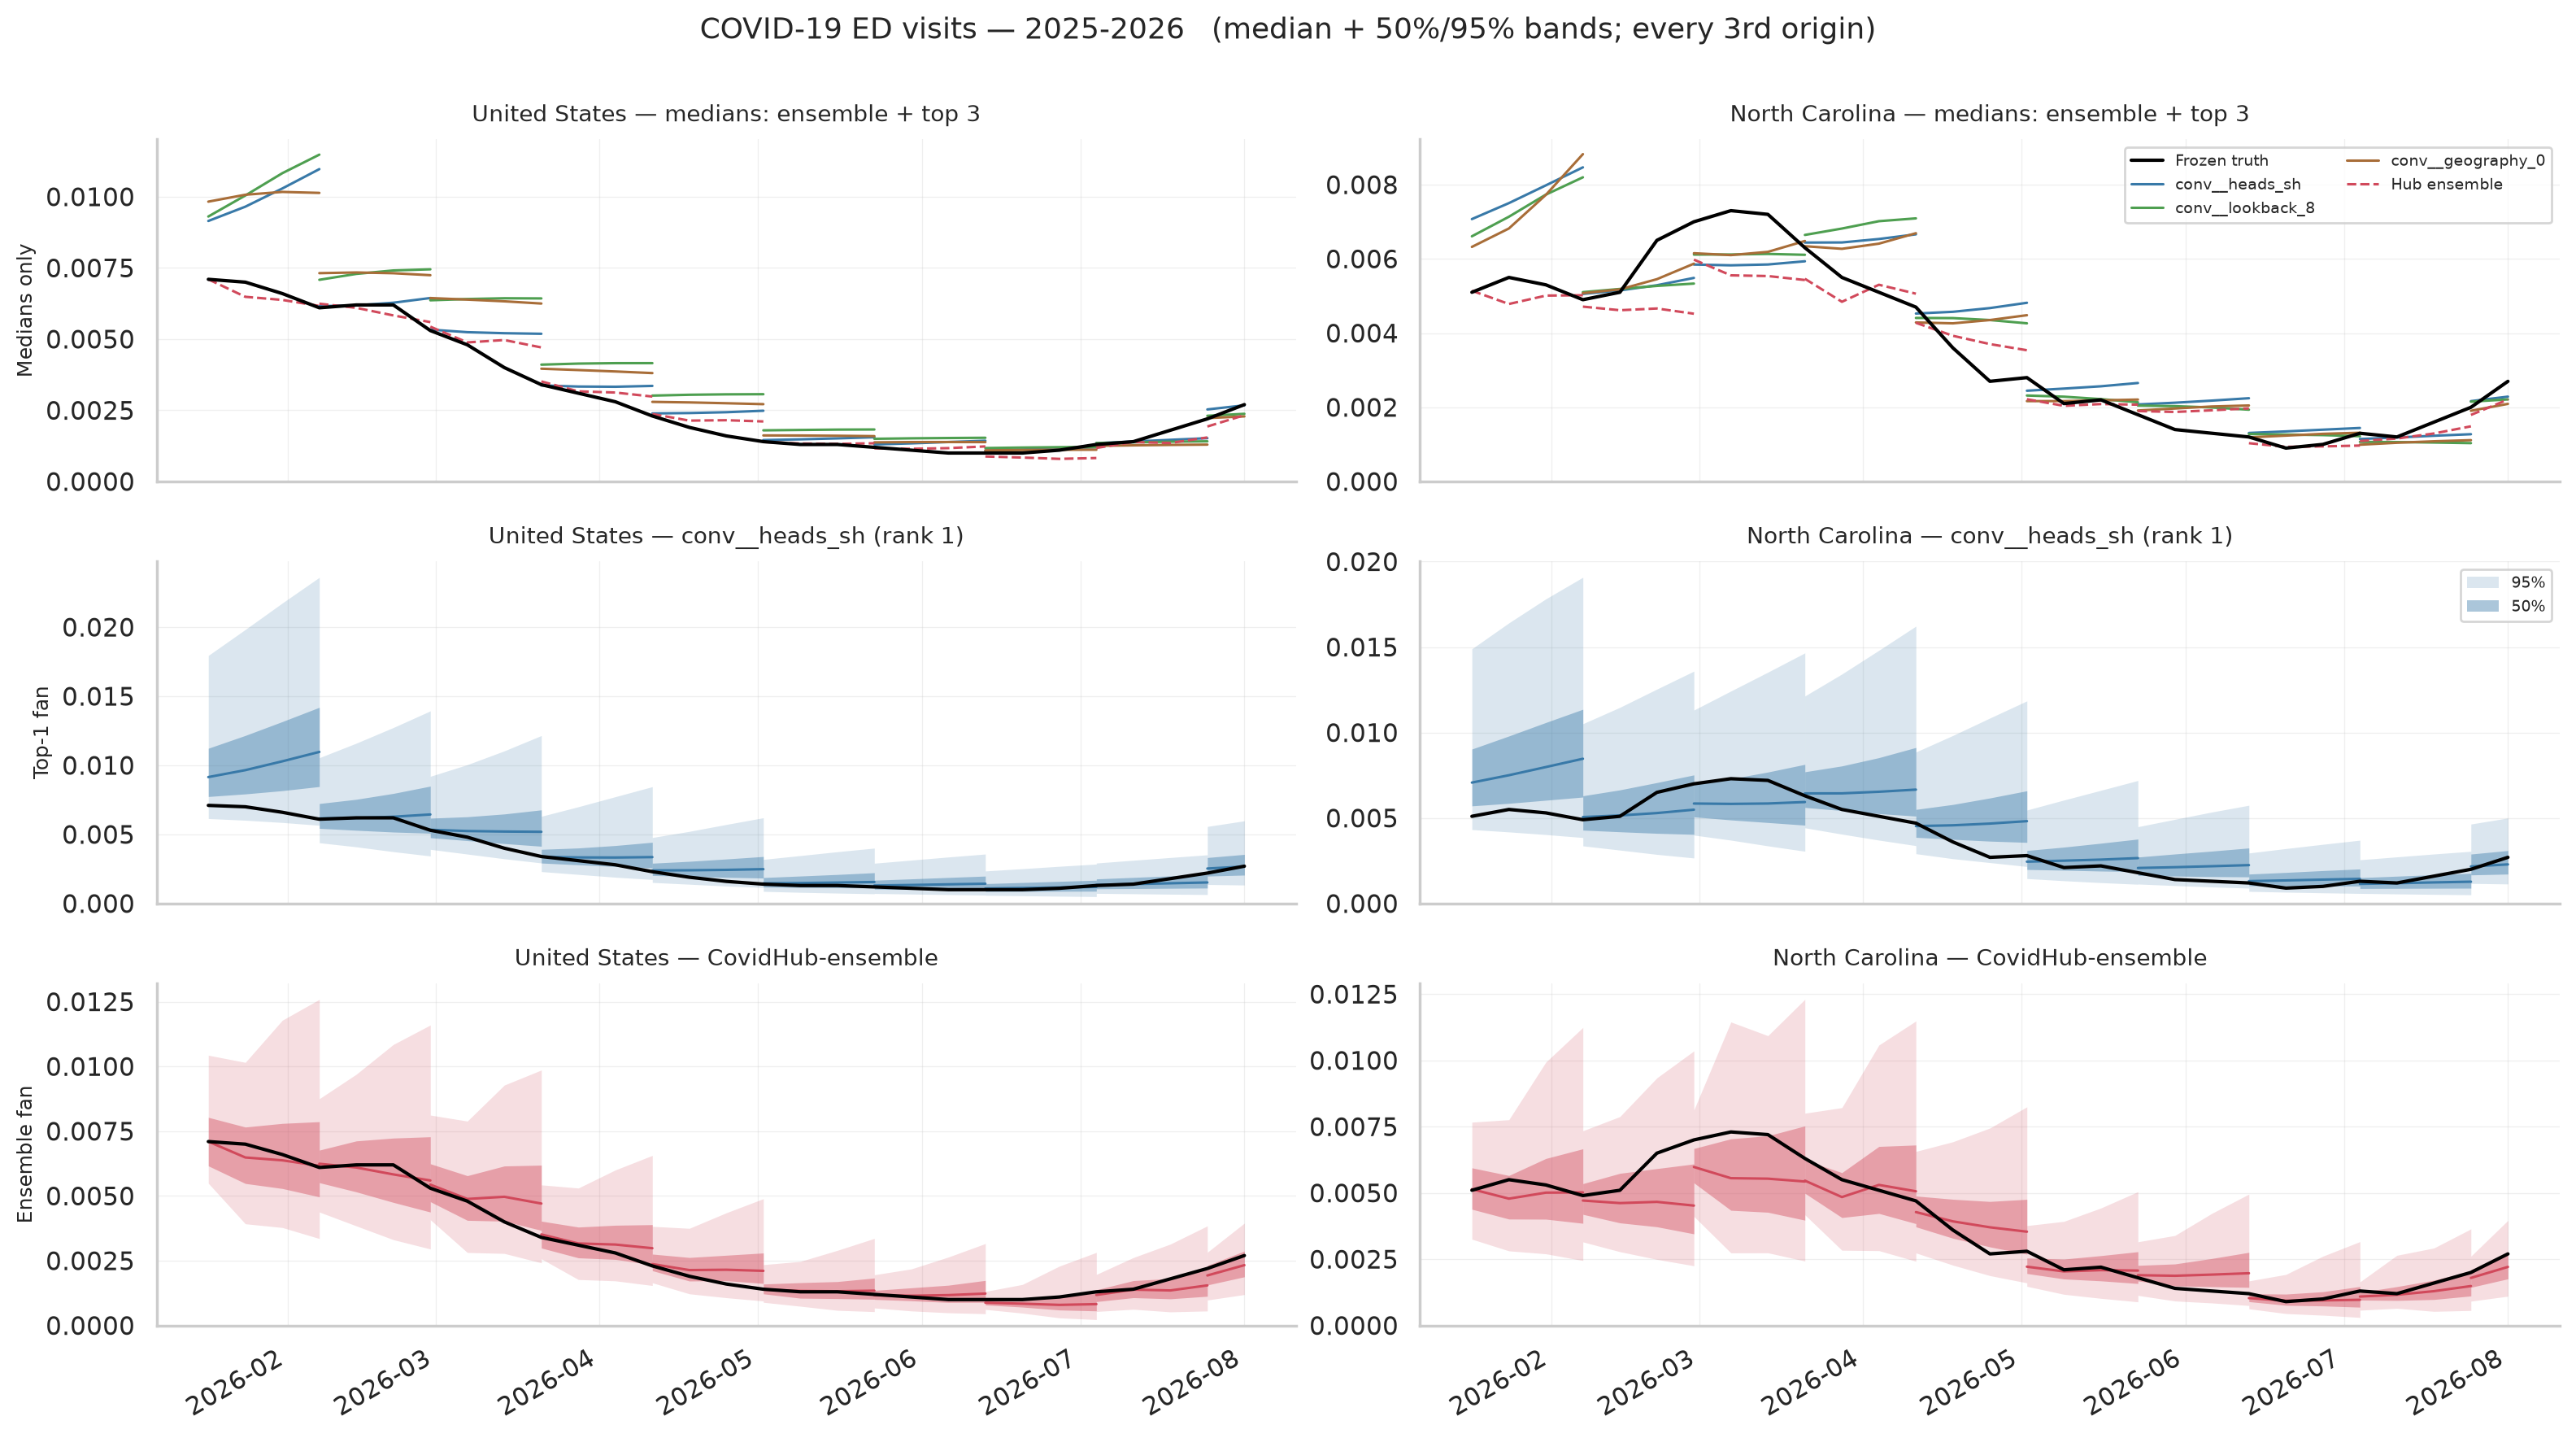
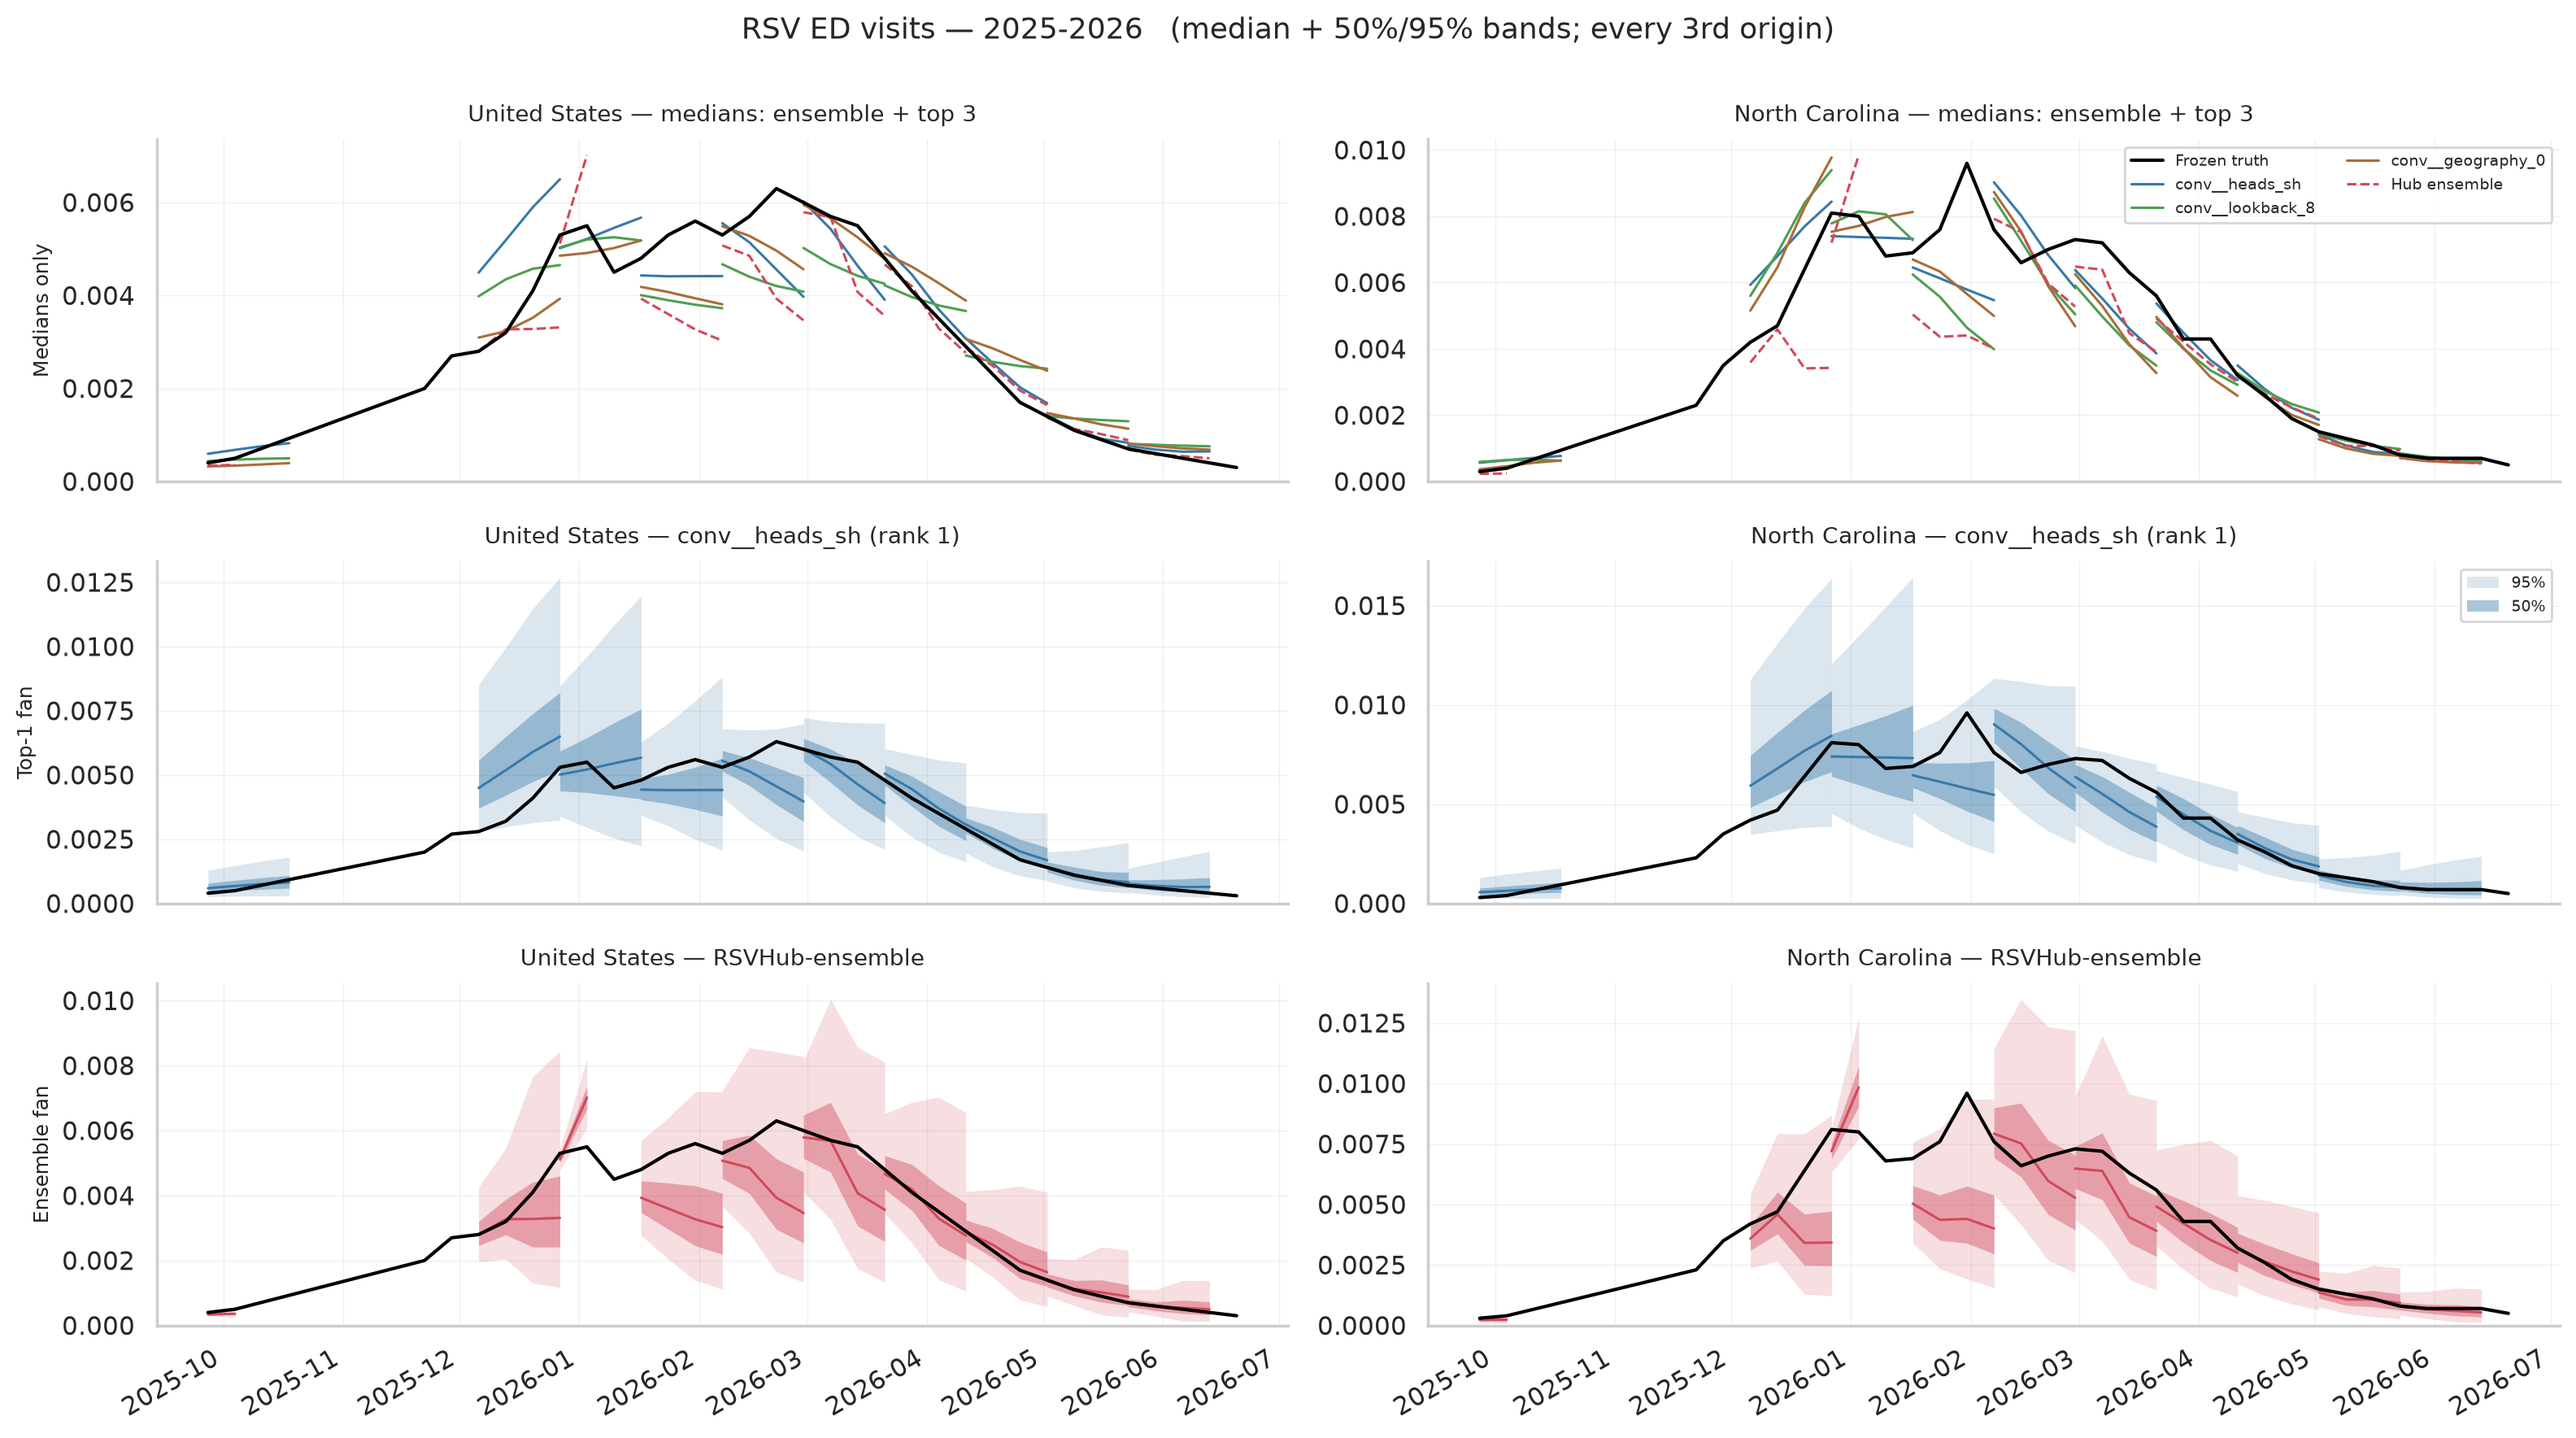
One figure per season and target. United States on the left, North Carolina on the right, and three rows:
- Medians only — the hub ensemble and the three best configurations, so the central paths can be compared without overlapping bands.
- Fan of the rank-1 configuration (
conv__heads_sh) — median with 50% and 95% intervals. - Fan of the hub ensemble — the same, for comparison.
Every third forecast origin is drawn; each configuration is shown at its median-scoring seed (42, 44, 44). Truth is the frozen black line.
Influenza admissions¶
COVID-19 admissions¶
RSV admissions¶
ED visits, 2025-2026¶
Rendered from saved forecasts.npz via tapestry.evaluation.hubs.export_b0
against the frozen truth, rather than through manager compare. Both
dependencies are available — EpiBenchmark (epibench, commit ed418962) and
R 4.5.0 with scoringutils 2.2.0 at /nas/longleaf/rhel9/apps/r/4.5.0 — but
running the full EpiBench pipeline was a deliberate scope decision: the §10.3
selection score is the total-WIS ratio rank already computes. EpiBench
relative WIS and the standard diagnostic plot set are not included here.
The third row against the second also shows the calibration gap directly: the ensemble's bands are visibly wider than the rank-1 configuration's at the same origins, which is the 0.819 US dispersion ratio seen as a picture.
The model is fooled by a second peak¶
The 2024-2025 influenza panels show the failure directly. National admissions rise to about 40,000 in early January, fall back to about 33,000, then climb to a higher second peak near 55,000 at the end of February. Forecasting from origins around that dip, all three configurations project continued decline: the fans point down from roughly 35,000 while truth more than doubles away from them. North Carolina shows the same shape.
Measured over every origin where truth had fallen for a week and then rose more than 10% within four weeks (896 such origin-locations):
| Influenza 2024-2025 rebounds, states/DC | B0 | Hub ensemble |
|---|---|---|
| Predicted down into the rebound | 77.7% | 56.2% |
| Four-week truth inside the 95% interval | 31.9% | 41.6% |
| Median miss at four weeks (admissions) | 226 | 203 |
These counts are state-level: 94 of the 95 influenza 2024-2025 rebound episodes are states/DC. The national series contributes a single rebound origin, at which both B0 and the ensemble predicted down and neither covered the outturn (B0 missing by 38,545 admissions, the ensemble by 28,582). The national double peak is therefore clear in the figure and in that one origin, but it is not something these counts establish on their own.
This is season-specific, not a general defect
Pooled over all six admissions cases, B0 actually handles rebounds better than the ensemble: it calls the direction down at 24.3% of rebound origins versus the ensemble's 29.1%, with a smaller median miss (7 vs 15) and better four-week coverage (90.1% vs 85.1%). Influenza 2023-2024 is the opposite extreme — B0 calls down at 2.2% of rebounds against the ensemble's 32.6%. The double-peak failure is real and severe in 2024-2025; it is not a property of the model everywhere.
A single-peak prior is the natural suspect: the training seasons rarely show a within-season rebound, and nothing in the six input channels marks one as possible. That is a hypothesis this experiment does not test.
Performance against the ensemble¶
32 of 51 configurations beat the official ensembles on the combined score. That headline hides the finding that actually matters:
| Configurations beating the ensemble | |
|---|---|
| States/DC tasks | 40 of 51 |
| US tasks | 6 of 51 |
The model is competitive at state level and loses badly on the national aggregate. Mean ratio by geography, across all 51 configurations:
| Target | US | States/DC |
|---|---|---|
| Flu admissions | 1.133 | 0.962 |
| COVID admissions | 1.062 | 0.969 |
| RSV admissions | 1.024 | 0.963 |
| Flu ED visits | 1.176 | 0.964 |
| COVID ED visits | 2.145 | 1.238 |
| RSV ED visits | 1.287 | 0.830 |
Even the leading group shows it: conv__lookback_8 and conv__geography_0 sit
at 1.22 and 1.24 on US tasks while beating the ensemble on states/DC. Only
conv__heads_sh — the one configuration with shared rather than separate
state/US heads — is below 1 on both (0.945 states, 0.969 US). That is the single
most suggestive result in the experiment, and with three seeds it is a hypothesis
worth testing, not a conclusion.
Per target, the picture is uneven. COVID ED visits is a systematic failure — 0 of 51 configurations beat the ensemble (mean ratio 1.247) — while RSV ED visits is a systematic win at 51 of 51 (mean 0.835). Flu admissions 23/51, COVID admissions 27/51, RSV admissions 32/51, flu ED 36/51.
Skill also improves with horizon for the leaders — conv__heads_sh runs
0.936 / 0.910 / 0.875 / 0.859 across horizons 0–3. B0 is relatively weakest at
nowcasting and strengthens further out, the opposite of the usual pattern, which
points at the nowcast rather than the dynamics as the place to look next.
Calibration is the outstanding defect¶
Coverage is short of nominal everywhere (mean over all 153 runs):
| Target | 50% cov. (model / ens.) | 95% cov. (model / ens.) |
|---|---|---|
| Flu admissions | 41.7 / 51.1 | 84.4 / 88.0 |
| COVID admissions | 41.5 / 52.5 | 83.5 / 94.2 |
| RSV admissions | 40.0 / 42.9 | 80.3 / 88.9 |
| Flu ED visits | 41.9 / 54.2 | 85.3 / 90.2 |
| COVID ED visits | 38.6 / 52.5 | 83.9 / 93.6 |
| RSV ED visits | 47.0 / 48.4 | 88.9 / 89.5 |
This is a genuine improvement on the withdrawn reference B0, which was severely overconfident (2.7–5.7% coverage at the 50% level). Intervals are now roughly the right width — dispersion ratios run 0.77–1.08 of the ensemble's — so the shortfall is misplacement rather than gross overconfidence. No calibration has been applied, and the saved early-stopping validation forecasts remain available for one.
How much of this is the United States?¶
US is one location in 52 but carries roughly half of all admissions WIS, because its per-task WIS is about fifty times a state's (influenza: 3,078 versus 62). The selection score sums WIS without reweighting by location, so for admissions the headline ranking is close to half a national ranking.
| Target | US share of total WIS | US share of tasks |
|---|---|---|
| Influenza admissions | 49.4% | 1.9% |
| RSV admissions | 47.1% | 1.9% |
| COVID-19 admissions | 44.7% | 1.9% |
| ED-visit targets | 1.1–2.0% | ~2% |
ED visits are proportions, so magnitude is comparable across locations and US carries no extra weight there.
Without the US, a different configuration wins¶
| Rank | States/DC only | Combined | US only |
|---|---|---|---|
| 1 | conv__lookback_8 |
0.9256 | 1.2197 |
| 2 | conv__count_transform_log1p |
0.9383 | 1.1929 |
| 3 | conv__geography_0 |
0.9382 | 1.2387 |
conv__lookback_8 leads the states/DC ranking at 0.9185; the combined
winner conv__heads_sh falls to sixth there (0.9453). The orderings genuinely
disagree — Spearman ρ between the states-only and US-only rankings is
−0.324, i.e. slightly negative. What helps states tends to hurt the US.
Forty of 51 configurations beat the ensemble on states/DC; only six do at US.
Why the US looks wrong¶
It is not a magnitude problem but an overconfidence problem:
| US | States/DC | |
|---|---|---|
| 50% coverage | 37.5% | 41.3% |
| 90% coverage | 73.1% | 77.0% |
| Dispersion vs ensemble | 0.819 | 1.008 |
| Overprediction share of WIS | 32.1% | 22.2% |
At state level the intervals are about the right width; at US they are roughly 18% too narrow, and the error is flat across horizons (ratio 1.07 → 1.10 from horizon 0 to 3) rather than growing, which points at level and calibration rather than accumulating dynamics.
The mechanism is visible in the architecture: the global latent draw is shared across locations, so state-level errors cancel when the national prediction is formed, and US uncertainty ends up closer to an average of state uncertainties than to a genuinely correlated national error.
What the experiment already rules out: separate state/US heads make it
worse. Turning them off on the conv reference improves US by −0.288; turning
them on at the anchor reference costs +0.109. The switch designed for this
problem backfires, plausibly because the US head sees 1/52 of the data. Spatial
attention is inconsistent (−0.092 on conv, +0.081 on anchor).
The untried directions are to form US as an aggregate of state predictions with an explicit correlated national error, or to calibrate interval width per geography using the saved early-stopping validation forecasts, which already exist and are unused. Neither is tested here.
Performance against the wider hub field¶
The ensemble is not the strongest hub model, so beating it is a weaker claim than it sounds. The ensemble's own position in each frozen field: 7/39 (flu 23-24), 19/51 (flu 24-25), 24/59 (flu 25-26), 9/18 (flu ED), 6/19 (COVID 24-25), 7/18 (COVID 25-26), 3/6 (COVID ED), 4/8 (RSV), 3/5 (RSV ED).
Placing the top three against every other model on identical tasks
(conv__heads_sh, mean WIS over seeds):
| Task | Position | Field | vs ensemble |
|---|---|---|---|
| Flu admissions 2023-2024 | 4 | 40 | 0.874 |
| Flu admissions 2024-2025 | 9 | 52 | 0.882 |
| Flu admissions 2025-2026 | 13 | 60 | 0.924 |
| Flu ED visits 2025-2026 | 8 | 19 | 0.956 |
| COVID admissions 2024-2025 | 6 | 20 | 0.728 |
| COVID admissions 2025-2026 | 8 | 19 | 1.066 |
| COVID ED visits 2025-2026 | 6 | 7 | 1.380 |
| RSV admissions 2025-2026 | 2 | 9 | 0.799 |
| RSV ED visits 2025-2026 | 3 | 6 | 0.784 |
A single B0 configuration placing 2nd of 9 on RSV admissions and 4th of 40 on 2023-24 flu is a real result for a six-channel model with no disease-specific structure. It is not near the top of the large flu fields, and COVID ED visits is last-but-one.
Not the same B0 as the frozen leaderboards
The Tapestry-B0-finalized-CV entry inside
data/evaluation/b0_hub_comparison_q23/*/leaderboard.csv is the older
reference run, not a crosses configuration. It scores 1.58–2.00 × the
ensemble and sits at 33/40, 46/52, 52/60 and similar. The crosses
configurations above are a substantial improvement on it; do not read the
frozen leaderboard rows as describing this experiment.
What the one-factor screen says¶
Representation dominates architecture. Moving the historical raw reference off
raw counts is worth far more than any architectural switch:
Change on raw |
Δ combined |
|---|---|
count_transform=log1p |
−0.131 |
count_transform=sqrt |
−0.128 |
count_transform=4rt |
−0.119 |
count_transform=rate |
−0.117 |
encoder=conv |
−0.046 |
| everything else | ≥ −0.027 |
Effects are also not transferable between references — the point of crossing three recipes rather than one:
spatial=attentionhurtsraw(+0.030) but removing it fromconvalso hurts slightly (−0.023 to remove, i.e. attention helps there). Its value depends on the surrounding recipe.noise=localhurtsraw(+0.021) and is the best change toanchor(−0.049).ed_transform=logitis the worst change toraw(+0.038) yet is part of the best-performing family.- By family,
convvariants occupy ranks 1–40 (median 13),anchor5–39 (median 23),raw19–51 (median 43).
Three changes improve on their own conv reference by more than the median seed
SD: shared heads (−0.055), 8-week history (−0.051), and dropping geography
(−0.038). All three simplify the model.
Assumptions and limitations¶
- Exploratory, not validation. All three seasons inform development, and the first two folds have later seasons in the fitting set. These are finalized retrospective CV results on assumed-truth NSSP values.
- Selection on the same folds used for ranking; the top three are chosen on the data that scores them.
- Three seeds cannot resolve the differences separating the leading group.
- One-factor screen only. Interactions were explicitly out of scope; a change that helps one reference cannot be assumed to help another.
- Provenance: all 153 runs at commit
5e788abwithgit_dirty=True(uncommitted changes at fit time). Per architecture policy, mixed/dirty commits are acceptable only during exploration — paper results must be rerun clean. comparewas skipped by choice, so this summary uses the total-WISrankpath only. EpiBenchmark and Rscoringutilsare both available; the EpiBench path was exercised end-to-end on one case as a check that it runs, but its scores were never diffed against these totals. Relative WIS, EpiBench diagnostics and the standard comparison plots are not included. This limits what can be said alongside the ranking, not the ranking itself.runs.csvhad been left stale from the first launch (9 V100 kernel failures recorded asfailed, the rest asplanned); it has been rebuilt from the attempt records and now reads 153complete.
Log¶
2026-09-15 — state scaling. Current data: very decent performance except in the US, due to a common scaling across all locations. That has been changed.
The us-cross-4 experiment is running with that fix. The earlier write-ups of
the us-cross-2 rerun and the proposed follow-up experiment have been removed
from these docs; this page is the surviving record of the crosses calibration.
Fit artifacts for this experiment are being cleared
The older experiment directories under data/experiments/ — including
b0-crosses — are slated for deletion to reclaim disk. Once that happens the
ranking-66c35025d66c/ artifacts referenced above are gone, and the
Reproducing commands below require refitting from scratch rather than
re-ranking existing runs. The numbers on this page are the record.
Reproducing¶
.venv/bin/python -m tapestry.models.manager status -e b0-crosses
.venv/bin/python -m tapestry.models.manager rank -e b0-crosses
rank regenerates ranking-66c35025d66c/ (it warns that runs carry a dirty
commit, as above). To add EpiBench relative WIS and the standard plot set later,
run manager compare -e b0-crosses. Both dependencies are present; R needs to
be on PATH first, which a Slurm job gets from module load r/4.5.0 (as in
scripts/b0_compare.sbatch) and an interactive shell gets from
export PATH=/nas/longleaf/rhel9/apps/r/4.5.0/bin:$PATH. Note that compare
is documented for a shortlist from rank, not all 51 configurations.