B0.0 — Crosses calibration
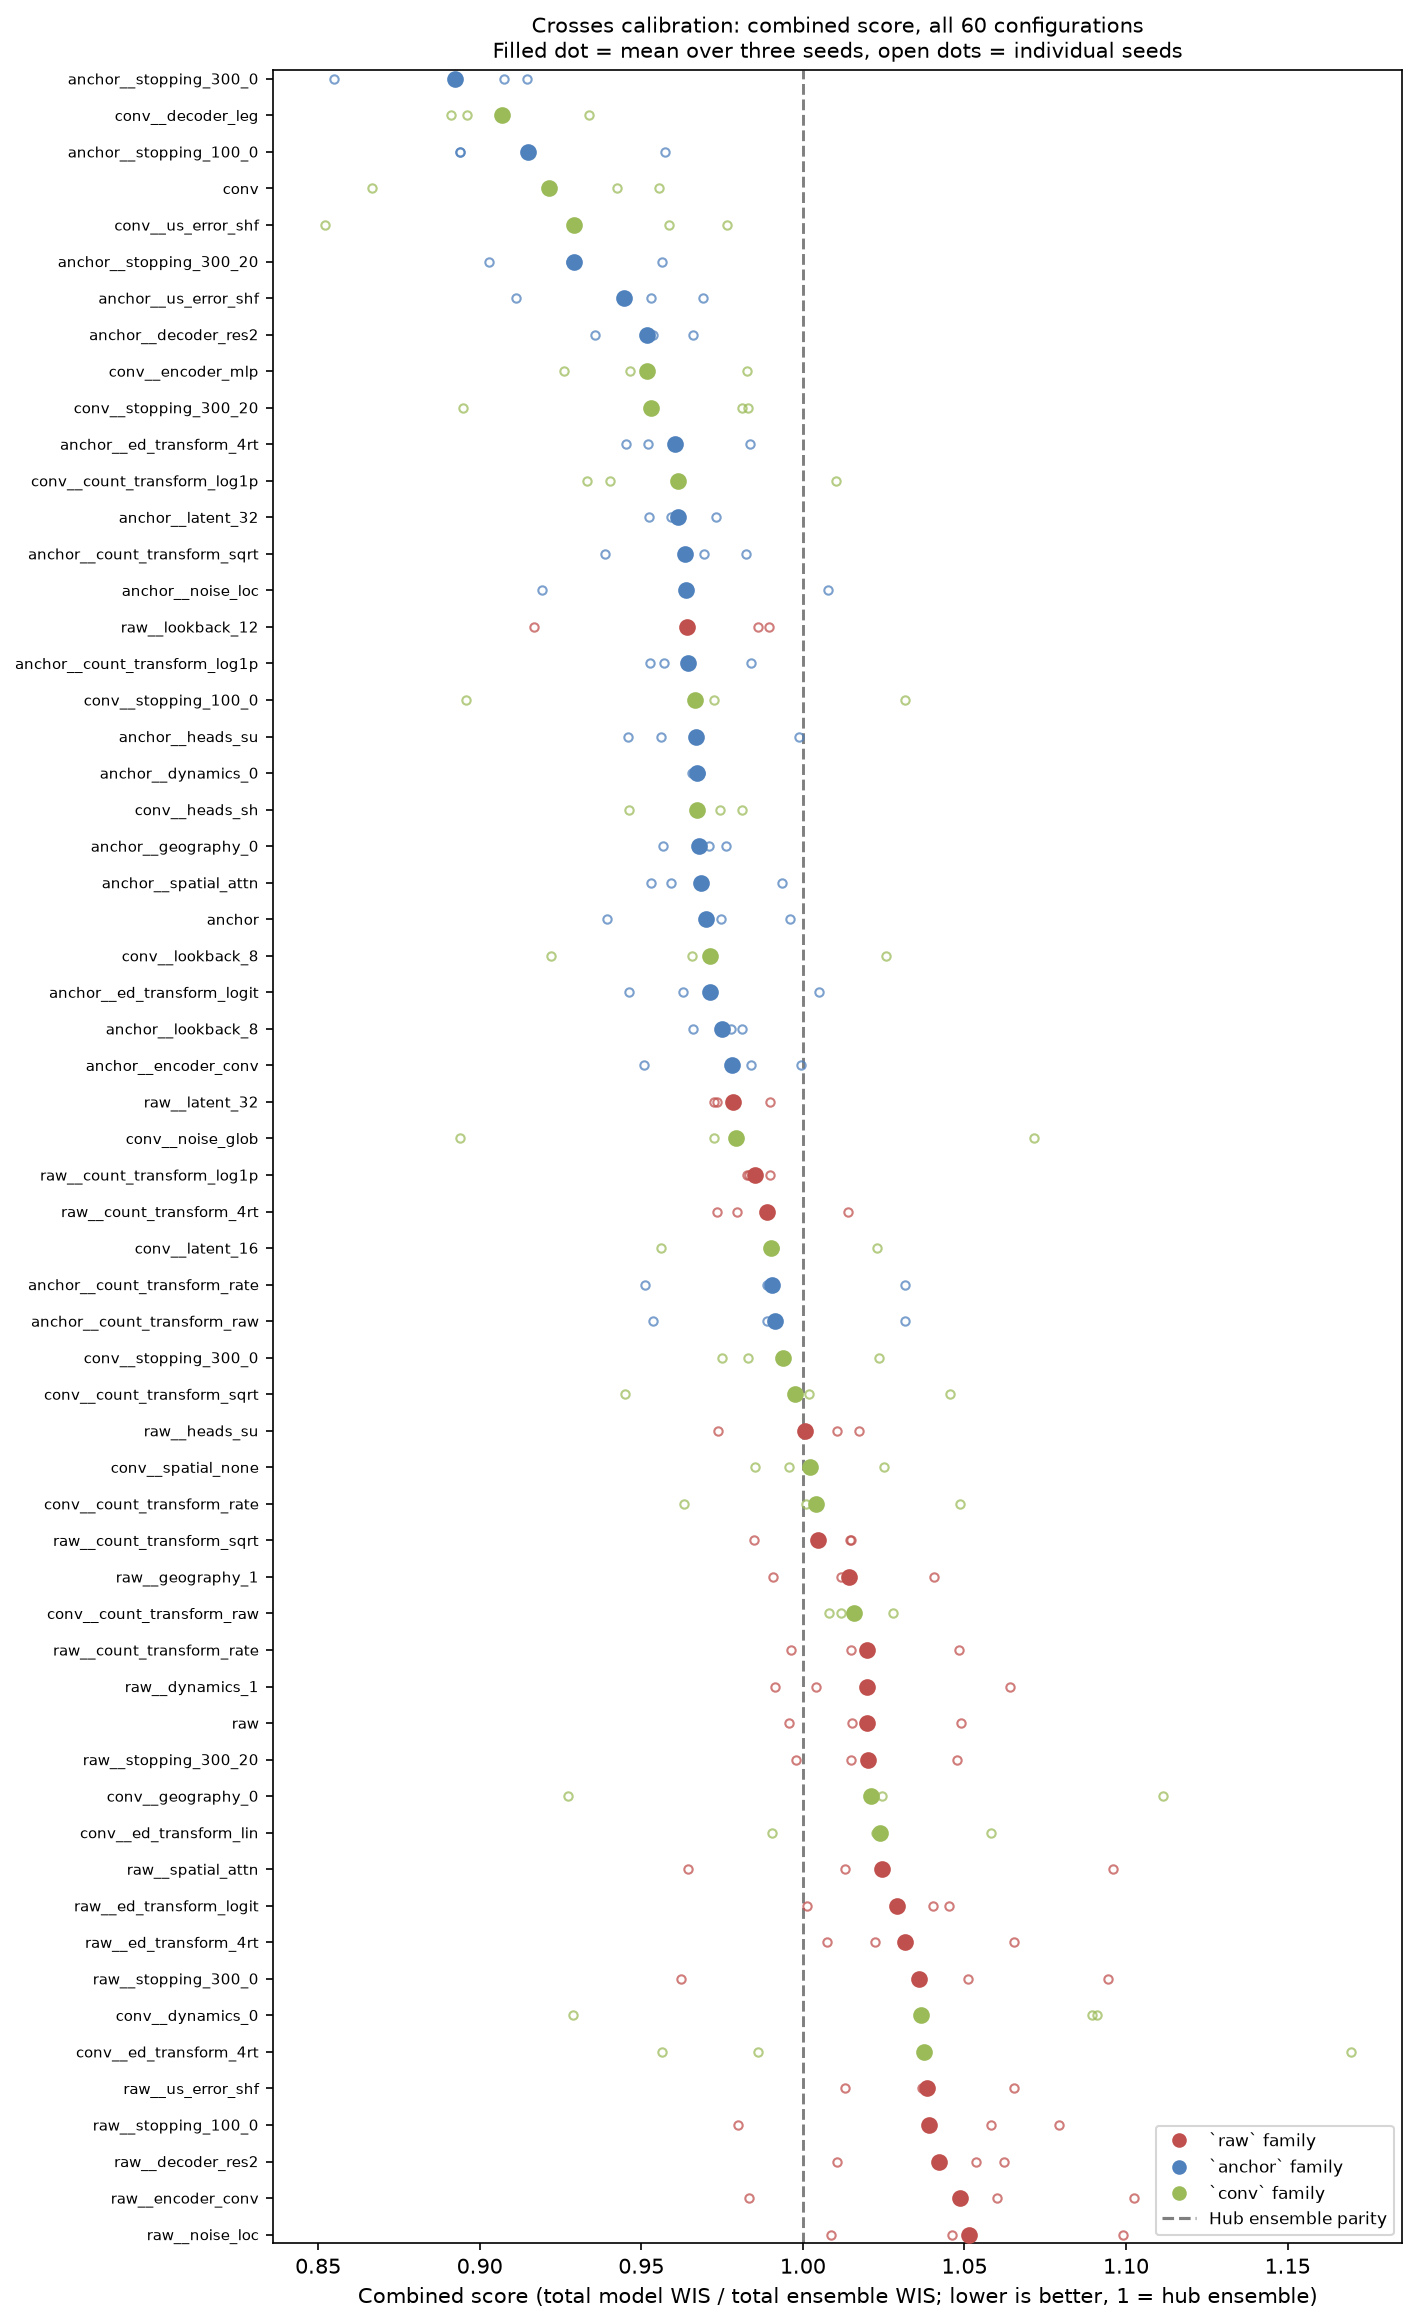
37 of 60 configurations beat the hub ensemble under the historical combined
score. anchor__stopping_300_0 ranks first at 0.8924, but scores 1.688 on
2023–2024 influenza admissions. Results depend on the season and location weights.
Experiment and score
60 configurations × 3 seeds = 180 season-CV runs and 540 season fits.
Stored experiment: b0-us-cross-4. The suite tests one-factor changes around
three reference recipes after the per-location input scaling fix (11a23ea).
The legacy run is superseded.
This page retains the historical score:
- For each target and season, divide total model WIS by total ensemble WIS on matching tasks, pooling locations, dates and horizons 0–3.
- Average season ratios within each target.
- Combine targets with weight 2 for admissions and 1 for ED visits.
- Report the mean and SD across three seeds.
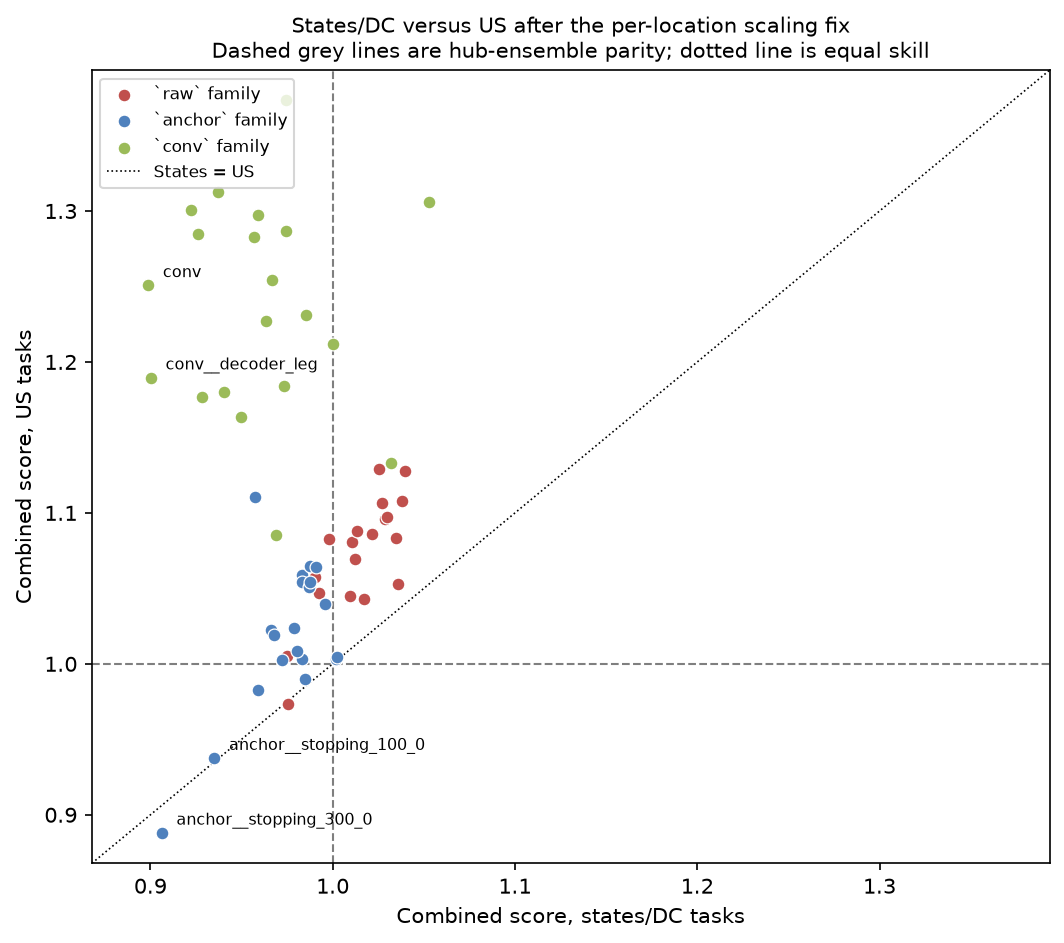
Lower is better; 1 means parity with the hub ensemble. This differs from the later objective with equal seasons, location-relative WIS and 20% US weight. See B0.1 for a comparison using rescored B0.0 forecasts.
| Reference | Recipe | Combined score | Rank |
|---|---|---|---|
raw |
Historical raw-count B0, 8 weeks, no geography/dynamics | 1.0199 | 46 |
anchor |
Fourth-root, geography, dynamics, 12 weeks, shared MLP, latent 16 | 0.9701 | 24 |
conv |
Anchor + convolution, residual decoder, latent 32, spatial attention, local noise, separate heads, logit ED | 0.9215 | 4 |
Ranking
| Rank | Configuration | Combined (mean ± seed SD) | States/DC | US |
|---|---|---|---|---|
| 1 | anchor__stopping_300_0 |
0.8924 ± 0.0327 | 0.9062 | 0.8879 |
| 2 | conv__decoder_leg |
0.9069 ± 0.0233 | 0.9003 | 1.1895 |
| 3 | anchor__stopping_100_0 |
0.9150 ± 0.0366 | 0.9351 | 0.9374 |
| 4 | conv (reference) |
0.9215 ± 0.0480 | 0.8988 | 1.2507 |
| 5 | conv__us_error_shf |
0.9291 ± 0.0674 | 0.9282 | 1.1770 |
| 6 | anchor__stopping_300_20 |
0.9293 ± 0.0269 | 0.9593 | 0.9824 |
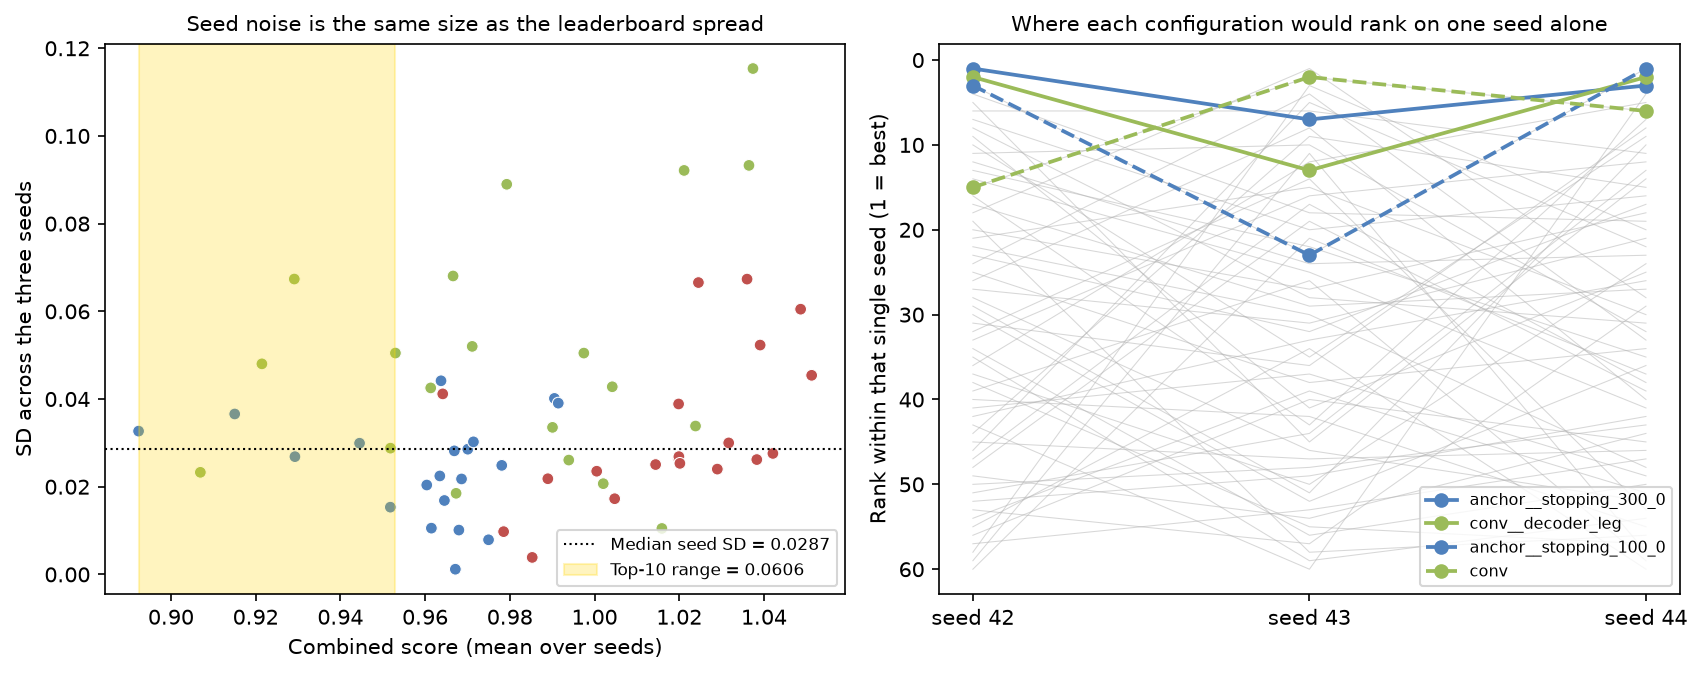
40 of 60 configurations beat the ensemble on states/DC tasks; 5 of 60 do so on US tasks. Scores and seed variation for the full suite:
Training length and season
| Family | ep50 | ep100 | ep300 | ep300 + patience 20 |
|---|---|---|---|---|
raw |
1.0199 | 1.0391 | 1.0360 | 1.0202 |
anchor |
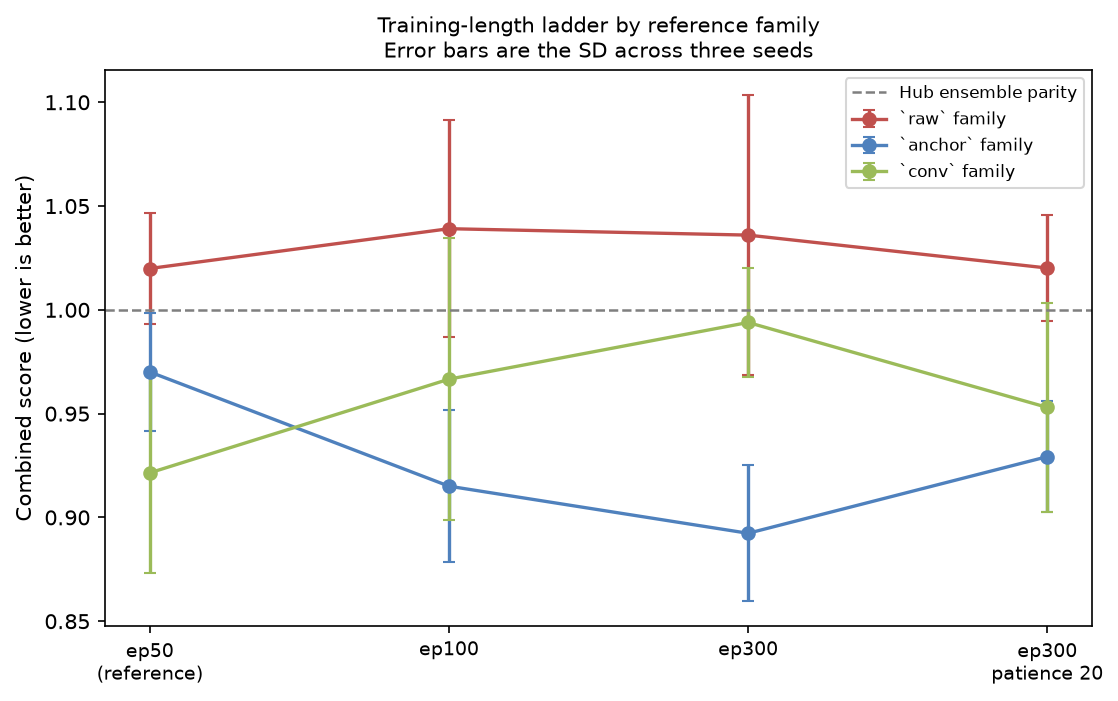
0.9701 | 0.9150 | 0.8924 | 0.9293 |
conv |
0.9215 | 0.9666 | 0.9939 | 0.9530 |
Longer training lowers the combined score for anchor and raises it for conv.
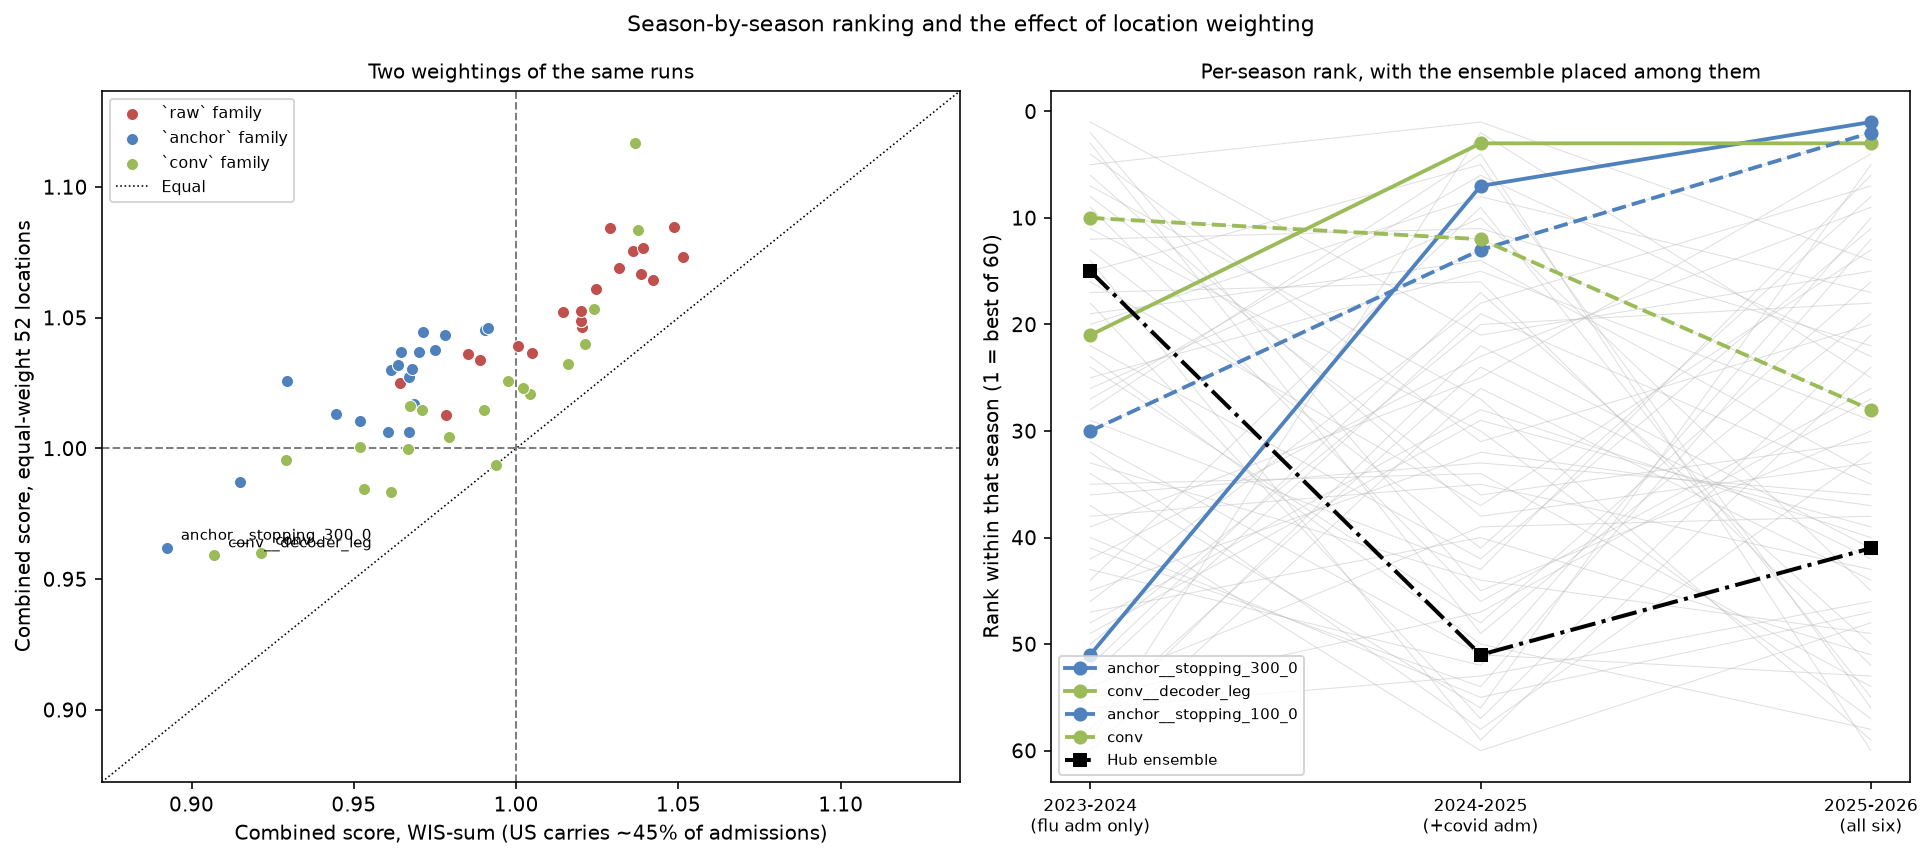
The improvement for anchor does not hold in every season:
| Configuration | 2023-2024 | 2024-2025 | 2025-2026 | Overall |
|---|---|---|---|---|
anchor__stopping_300_0 |
1.688 (51) | 0.832 (7) | 0.837 (1) | 0.8924 (1) |
conv__decoder_leg |
1.145 (21) | 0.811 (3) | 0.925 (3) | 0.9069 (2) |
anchor__stopping_100_0 |
1.229 (30) | 0.865 (13) | 0.889 (2) | 0.9150 (3) |
conv |
0.966 (10) | 0.865 (12) | 0.969 (28) | 0.9215 (4) |
conv__us_error_shf |
1.107 (20) | 0.846 (8) | 0.962 (17) | 0.9291 (5) |
anchor__stopping_300_20 |
0.946 (5) | 0.778 (1) | 0.960 (14) | 0.9293 (6) |
anchor__us_error_shf |
0.985 (12) | 0.848 (11) | 0.965 (22) | 0.9445 (7) |
anchor__decoder_res2 |
0.879 (1) | 0.905 (21) | 0.960 (15) | 0.9518 (8) |
conv__encoder_mlp |
1.213 (27) | 0.830 (6) | 0.967 (23) | 0.9518 (9) |
conv__stopping_300_20 |
1.172 (26) | 0.848 (10) | 1.014 (45) | 0.9530 (10) |
anchor__ed_transform_4rt |
0.896 (2) | 0.976 (45) | 0.972 (30) | 0.9604 (11) |
conv__count_transform_log1p |
1.514 (39) | 0.925 (25) | 0.927 (4) | 0.9613 (12) |
At 300 epochs, adding patience 20 lowers the 2023–2024 score from 1.688 to 0.946, while raising the combined score from 0.8924 to 0.9293. These results show a tradeoff across seasons; they do not establish its cause.
The scored season is excluded from fitting and scaling. Early stopping uses validation data within the training seasons.
One-factor changes
Deltas compare each configuration with its own reference; negative is better.
Anchor
| Change | Δ combined | Δ states | Δ US |
|---|---|---|---|
stopping_300_0 |
−0.0777 | −0.0811 | −0.1773 |
stopping_100_0 |
−0.0550 | −0.0522 | −0.1277 |
stopping_300_20 |
−0.0408 | −0.0280 | −0.0827 |
us_error_shf |
−0.0256 | −0.0211 | −0.0430 |
decoder_res2 |
−0.0183 | −0.0193 | −0.0461 |
ed_transform_4rt |
−0.0097 | −0.0149 | −0.0627 |
count_transform_raw |
+0.0214 | +0.0153 | −0.0608 |
count_transform_rate |
+0.0205 | +0.0144 | −0.0617 |
Convolution
| Change | Δ combined | Δ states | Δ US |
|---|---|---|---|
decoder_leg |
−0.0145 | +0.0015 | −0.0612 |
us_error_shf |
+0.0076 | +0.0294 | −0.0737 |
encoder_mlp |
+0.0303 | +0.0415 | −0.0707 |
heads_sh |
+0.0458 | +0.0699 | −0.1651 |
geography_0 |
+0.0997 | +0.0755 | +0.1226 |
ed_transform_lin |
+0.1024 | +0.1014 | −0.0387 |
dynamics_0 |
+0.1150 | +0.1539 | +0.0553 |
ed_transform_4rt |
+0.1159 | +0.1331 | −0.1176 |
Raw
| Change | Δ combined | Δ states | Δ US |
|---|---|---|---|
lookback_12 |
−0.0558 | −0.0365 | −0.0962 |
latent_32 |
−0.0414 | −0.0372 | −0.0647 |
count_transform_log1p |
−0.0346 | −0.0199 | −0.0225 |
count_transform_4rt |
−0.0309 | −0.0217 | −0.0122 |
encoder_conv |
+0.0287 | +0.0275 | +0.0579 |
noise_loc |
+0.0313 | +0.0260 | +0.0385 |
Effects depend on the reference. For example, convolution raises the score on
raw and anchor, while the bundled conv reference ranks fourth overall.
The reference ranking cannot isolate the contribution of convolution.
Location weights
The historical score pools WIS across locations. The US contributes 47.2% of influenza-admissions WIS. Averaging the 52 location-specific ratios equally reduces its weight to 1/52 and changes the ranking:
| Configuration | Equal-weight 52 (± seed SD) | Rank | WIS-sum | Rank | Shift |
|---|---|---|---|---|---|
conv__decoder_leg |
0.9591 ± 0.0201 | 1 | 0.9069 | 2 | +1 |
conv |
0.9601 ± 0.0253 | 2 | 0.9215 | 4 | +2 |
anchor__stopping_300_0 |
0.9620 ± 0.0255 | 3 | 0.8924 | 1 | −2 |
conv__count_transform_log1p |
0.9832 ± 0.0500 | 4 | 0.9613 | 12 | +8 |
conv__stopping_300_20 |
0.9844 ± 0.0370 | 5 | 0.9530 | 10 | +5 |
anchor__stopping_100_0 |
0.9870 ± 0.0177 | 6 | 0.9150 | 3 | −3 |
conv__stopping_300_0 |
0.9938 ± 0.0323 | 7 | 0.9939 | 36 | +29 |
conv__us_error_shf |
0.9957 ± 0.0702 | 8 | 0.9291 | 5 | −3 |
conv__stopping_100_0 |
0.9996 ± 0.0661 | 9 | 0.9666 | 18 | +9 |
conv__encoder_mlp |
1.0006 ± 0.0270 | 10 | 0.9518 | 9 | −1 |
Under equal location weights, 9 of 60 configurations beat the ensemble, compared with 37 under the historical score. None beat it in all three seasons. This equal-location score also differs from B0.1's 20% US weighting.
Coverage and horizon
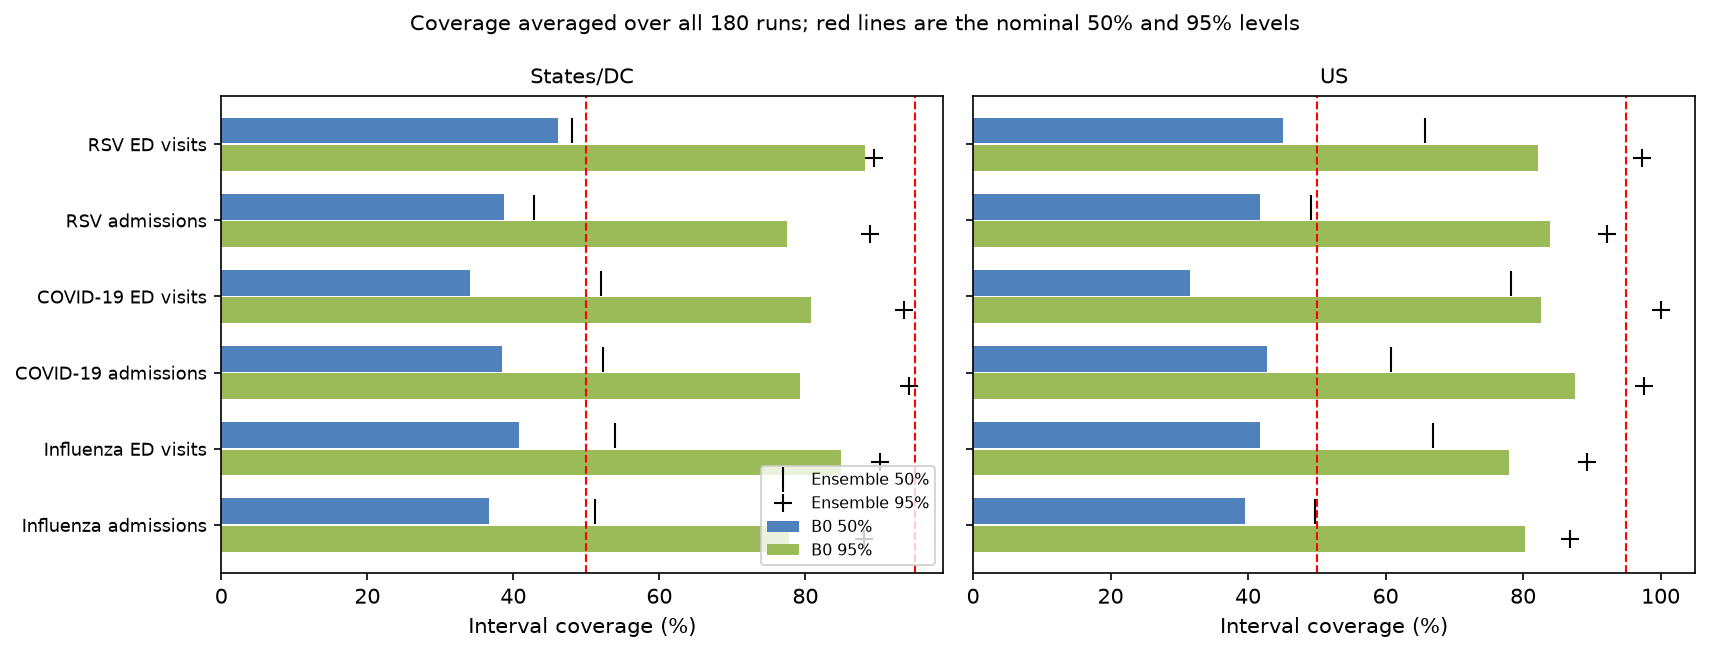
Coverage percentages averaged over all 180 runs; each cell gives model / ensemble:
| Target | 50% states (model/ens) | 95% states | 50% US | 95% US |
|---|---|---|---|---|
| Flu admissions | 36.7 / 51.2 | 77.7 / 88.0 | 39.5 / 49.7 | 80.3 / 86.8 |
| COVID admissions | 38.5 / 52.3 | 79.3 / 94.2 | 42.8 / 60.7 | 87.6 / 97.6 |
| RSV admissions | 38.7 / 42.8 | 77.5 / 88.9 | 41.8 / 49.1 | 84.0 / 92.2 |
| Flu ED visits | 40.7 / 53.9 | 84.9 / 90.3 | 41.7 / 67.0 | 78.0 / 89.3 |
| COVID ED visits | 34.1 / 52.0 | 80.8 / 93.5 | 31.6 / 78.2 | 82.6 / 100.0 |
| RSV ED visits | 46.2 / 48.1 | 88.2 / 89.4 | 45.0 / 65.8 | 82.2 / 97.3 |
Coverage is below nominal levels for all reported target/geography combinations. No interval calibration was applied. Coverage alone does not identify the cause of the errors.
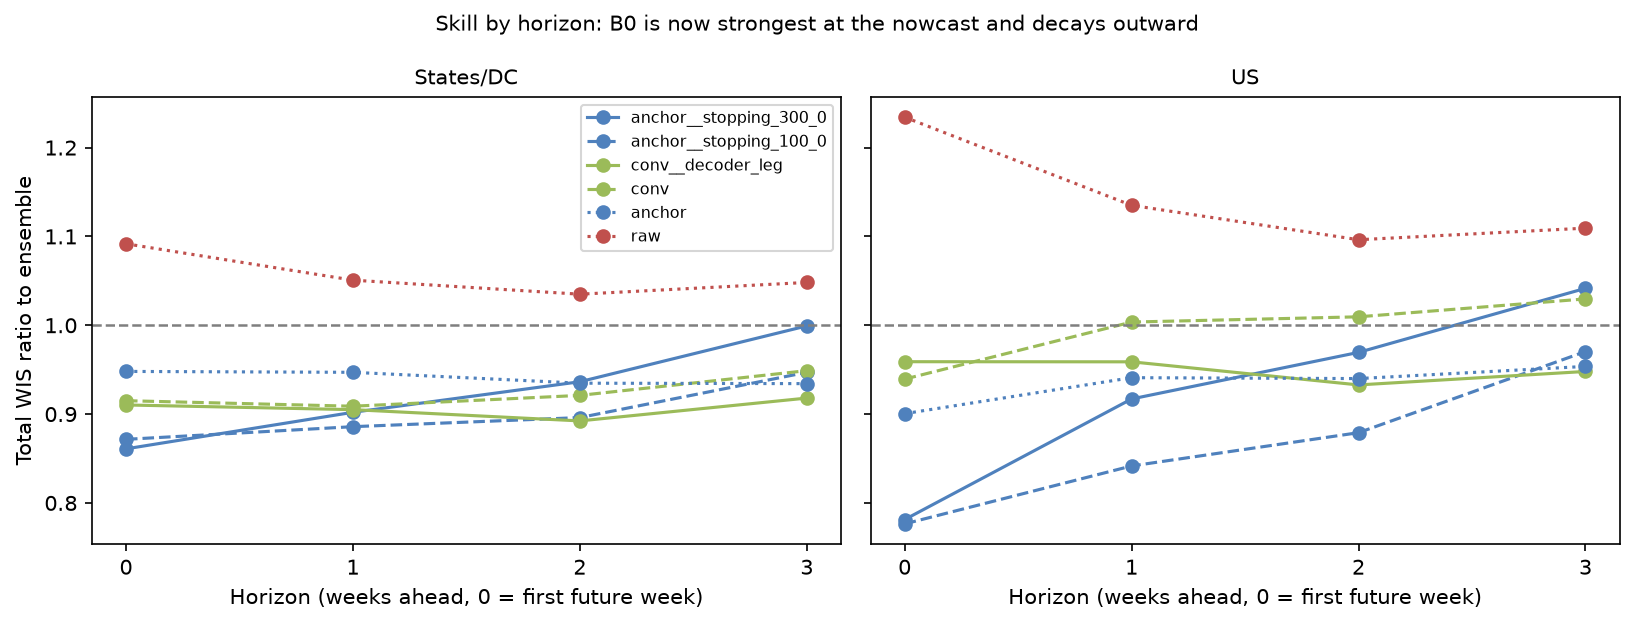
For anchor__stopping_300_0, states/DC WIS ratios rise from 0.861 at horizon 0
to 0.999 at horizon 3; US ratios rise from 0.781 to 1.042.
Fan plots
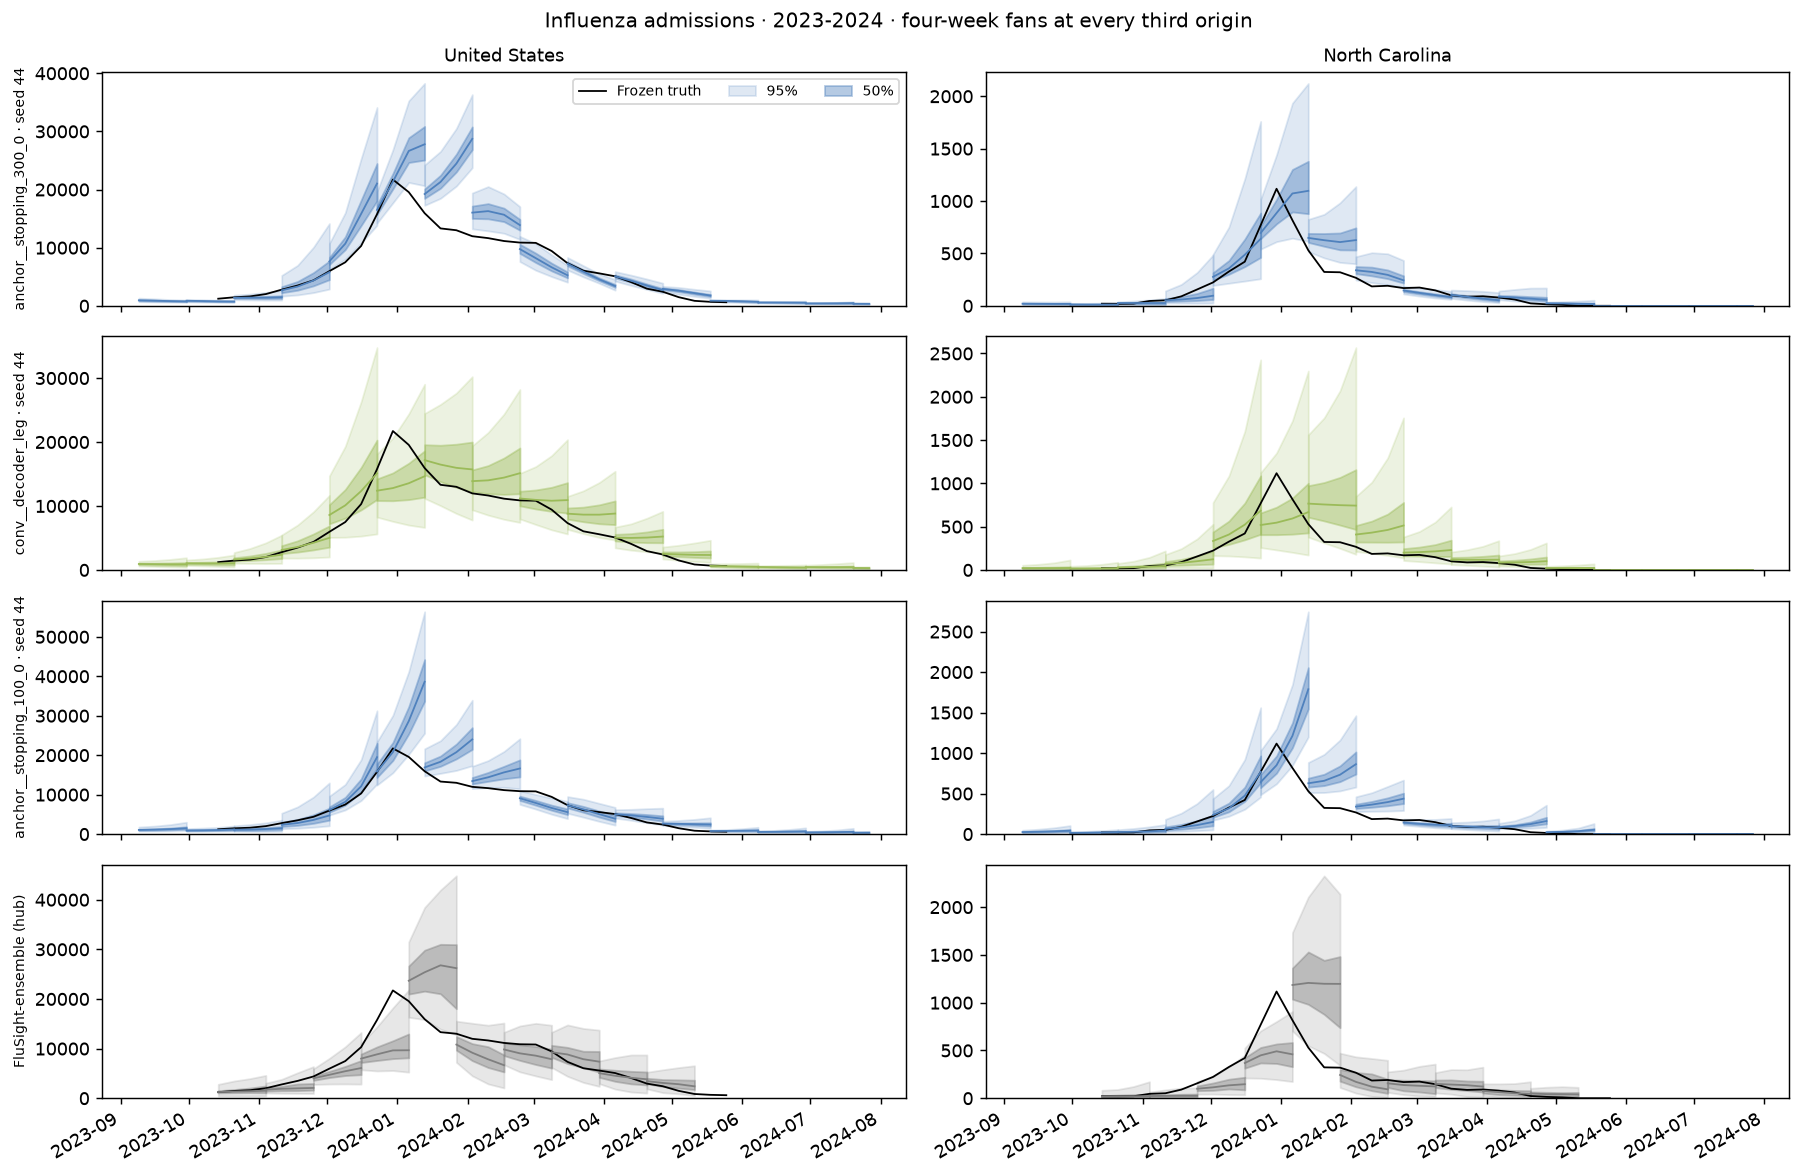
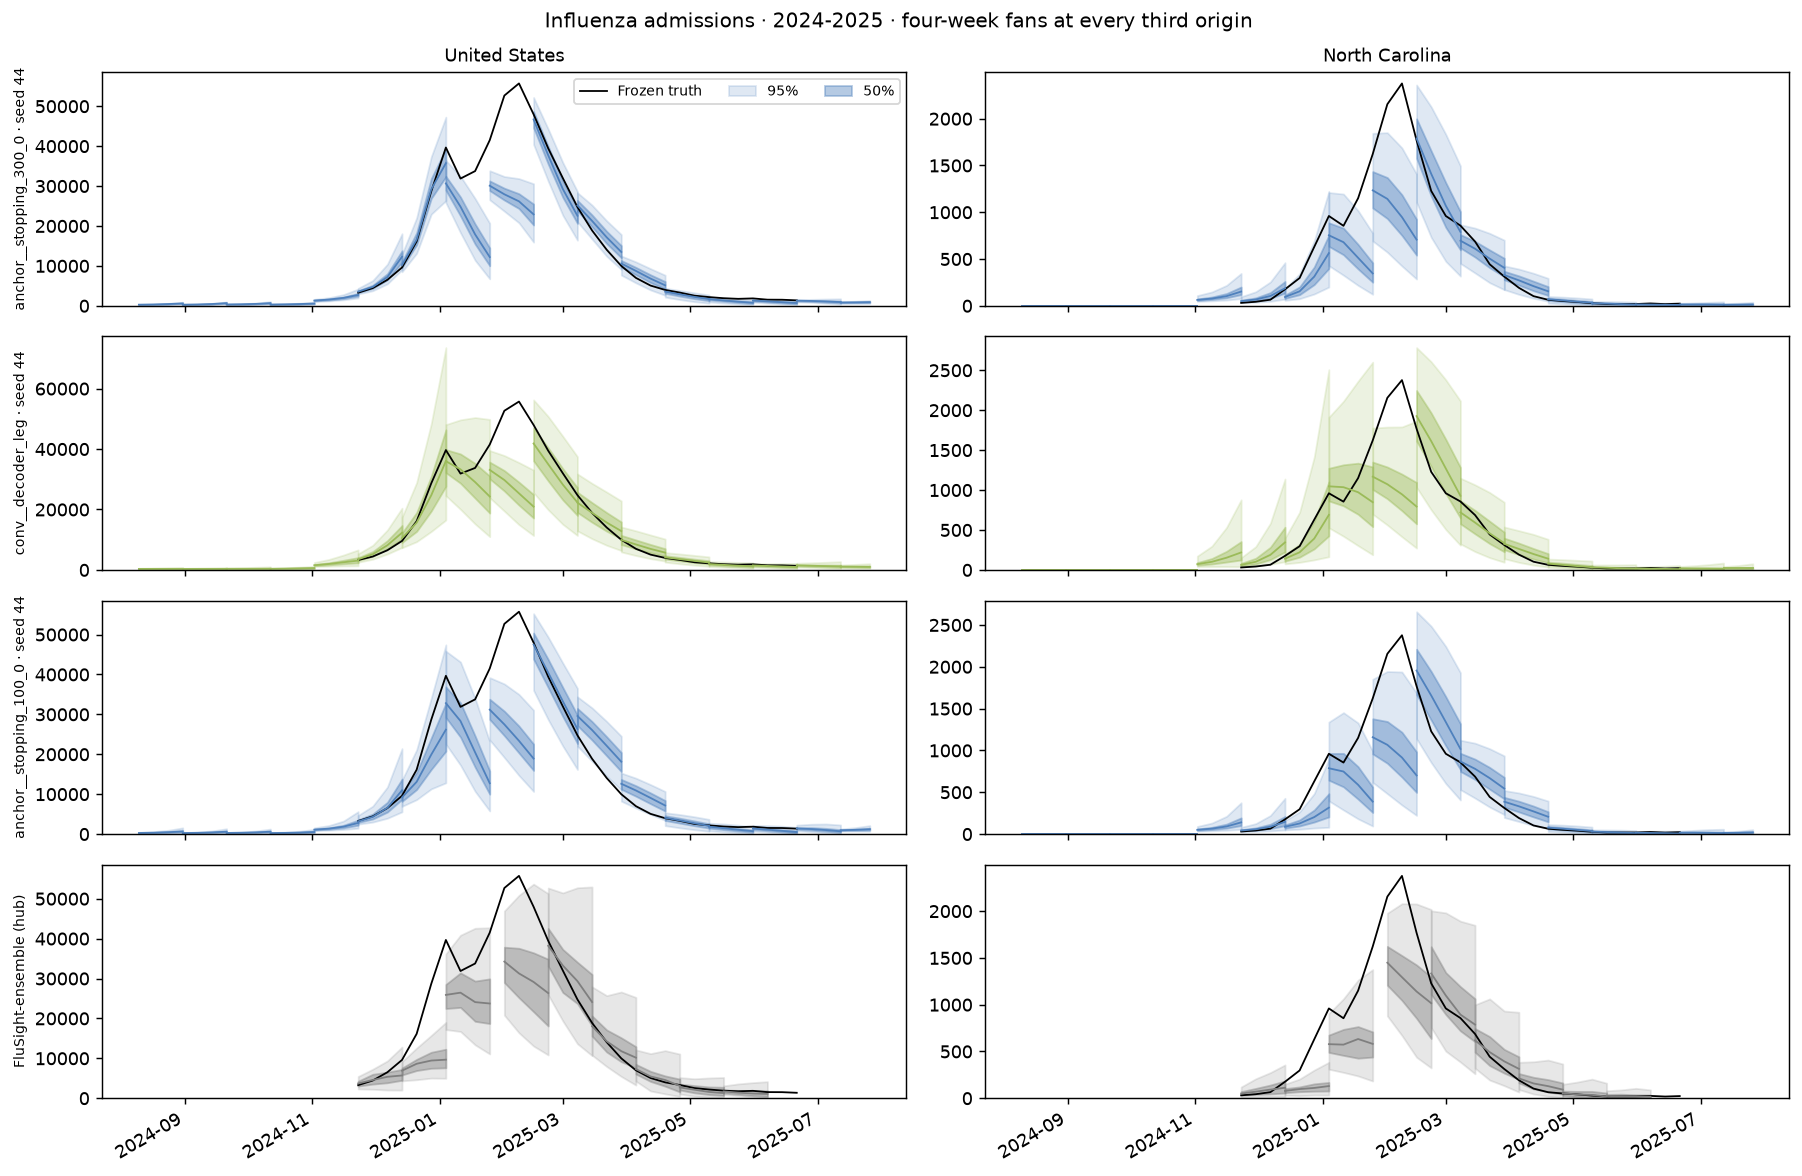
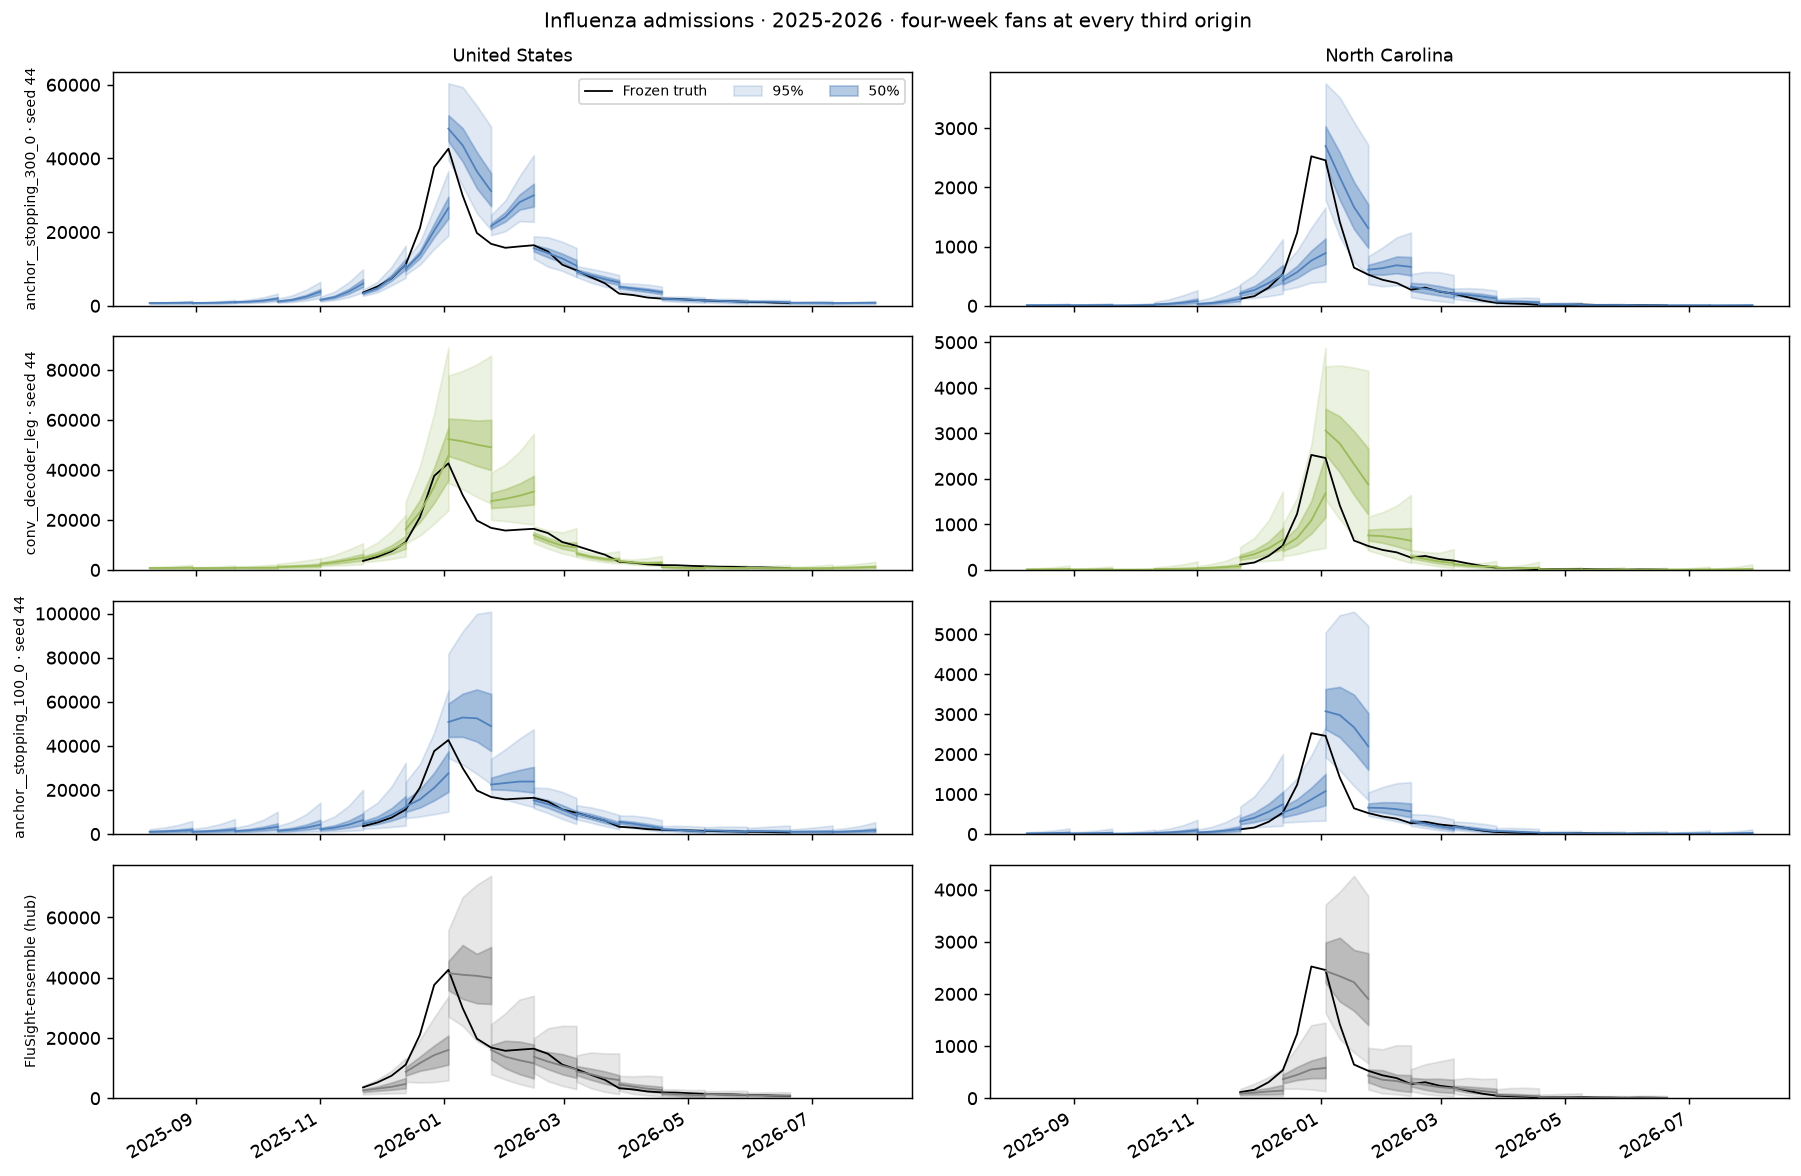
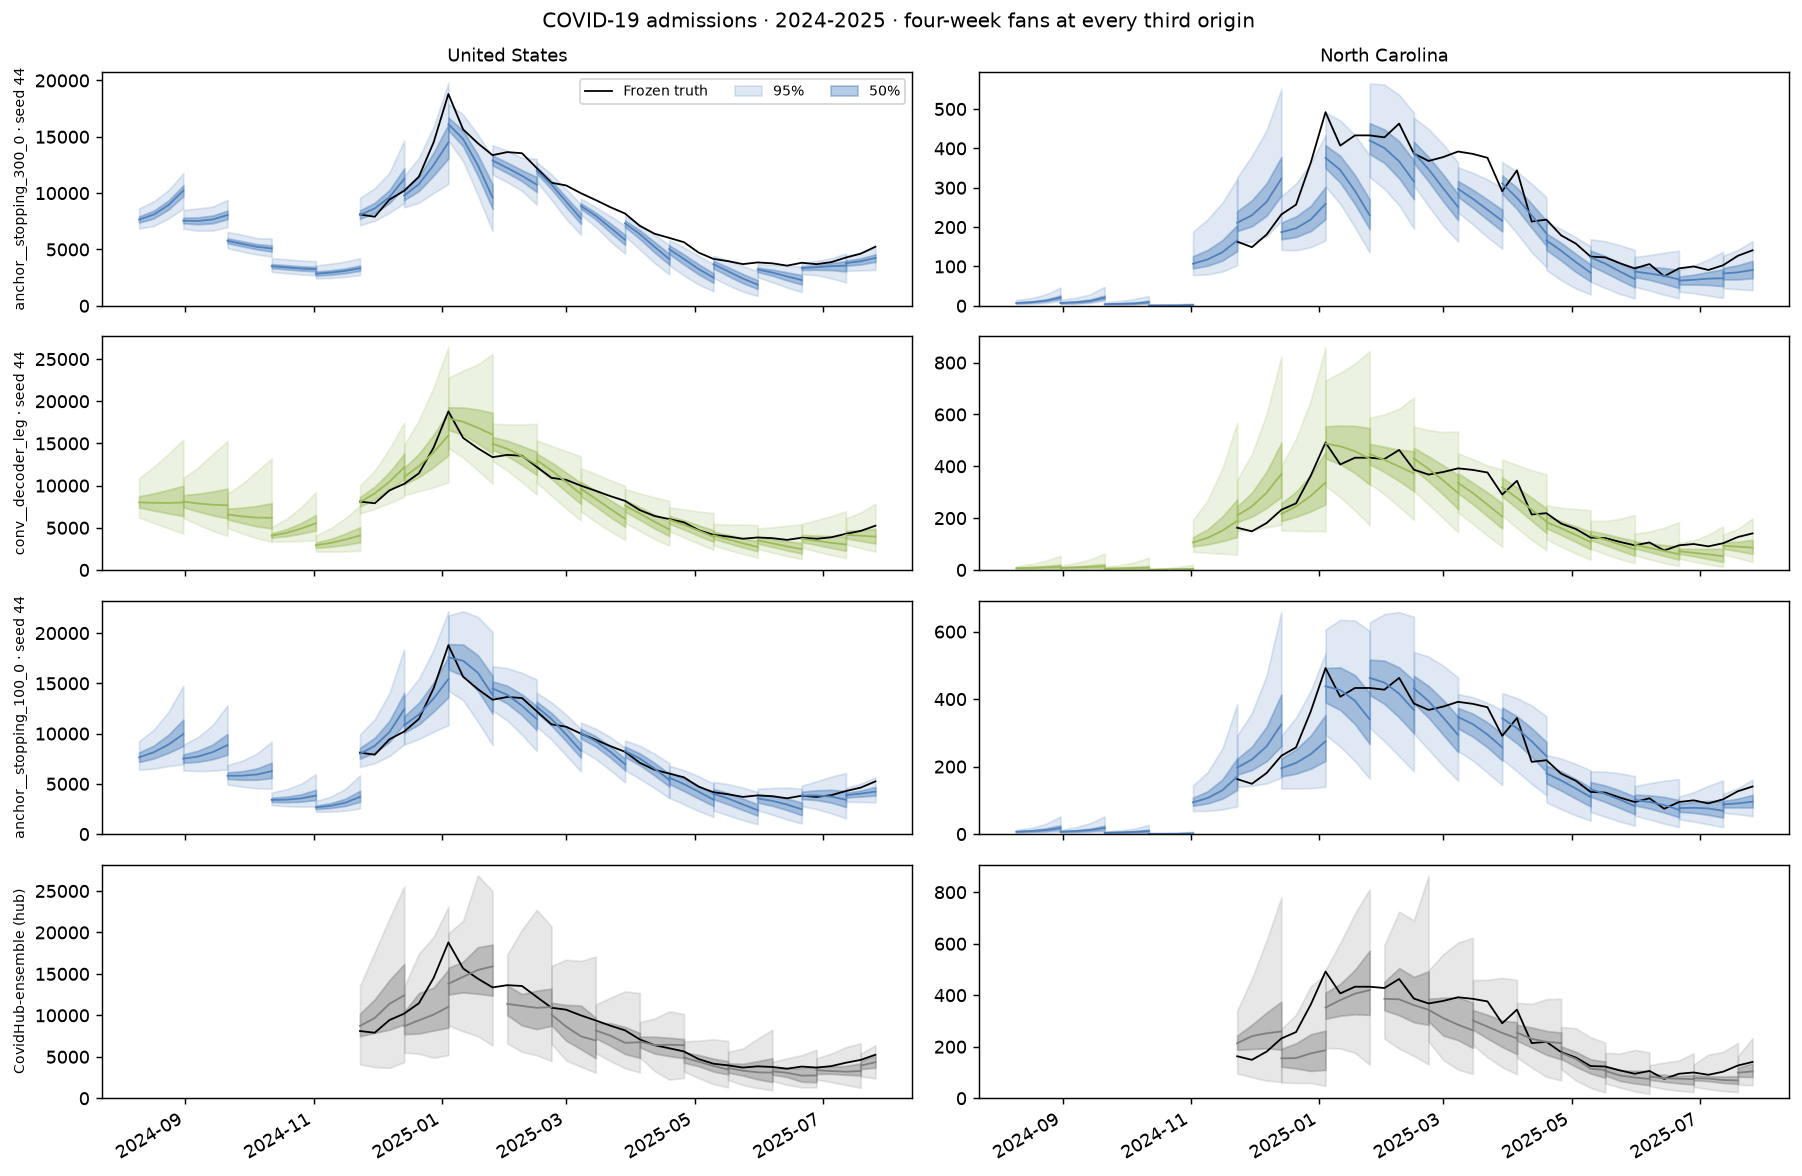
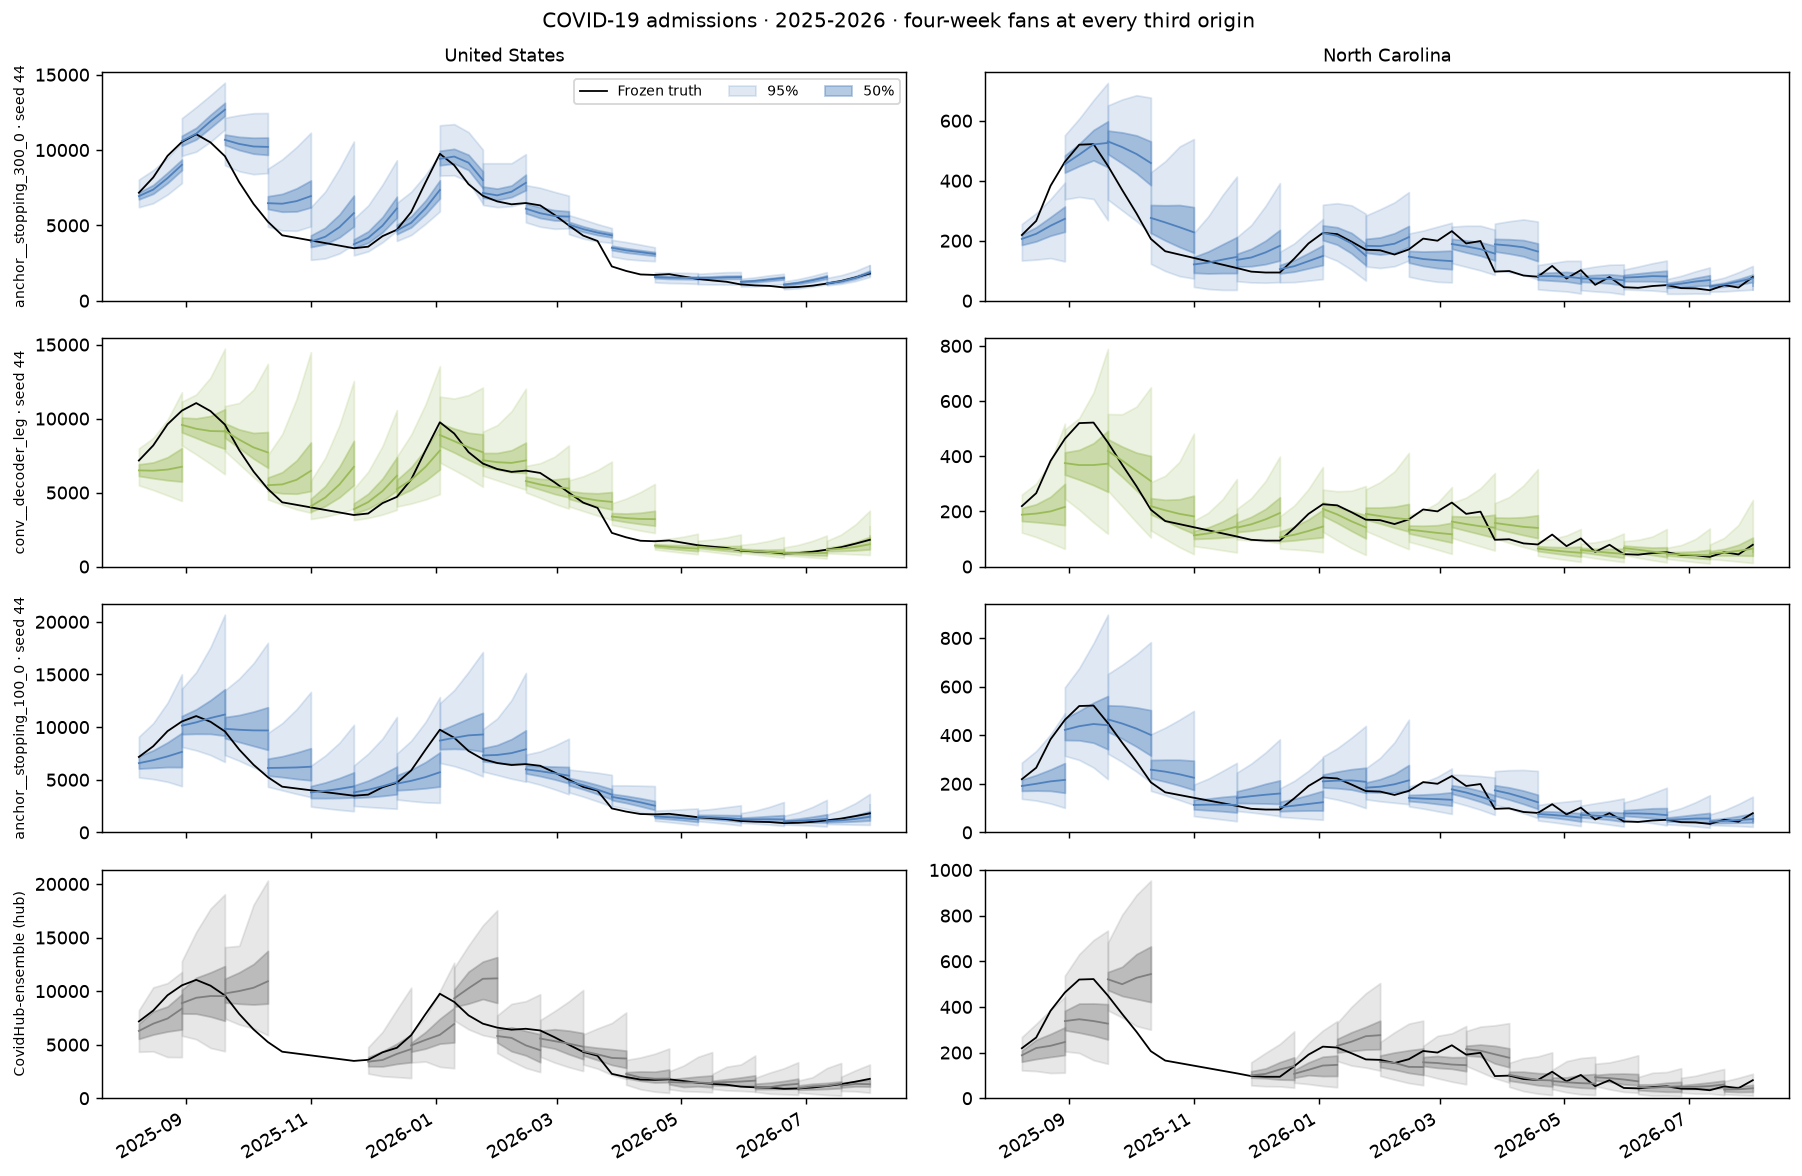
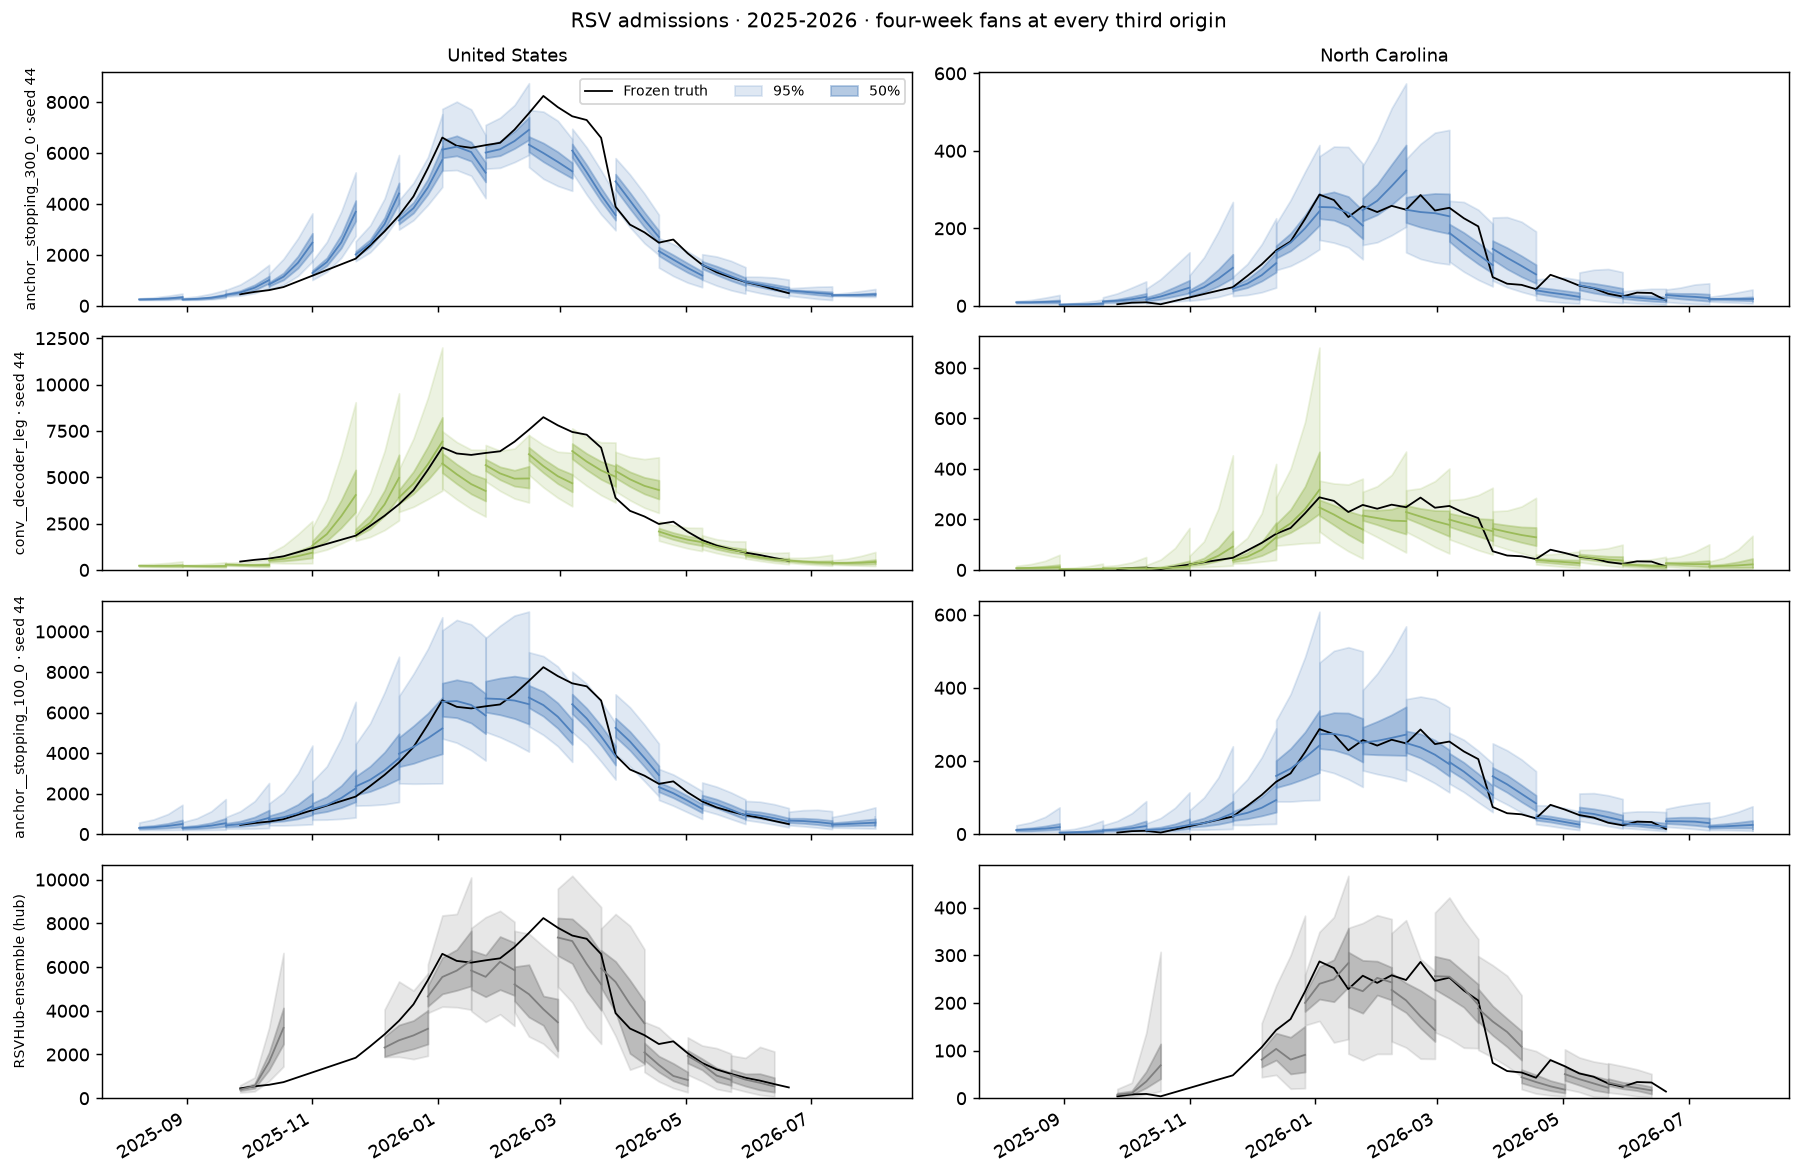
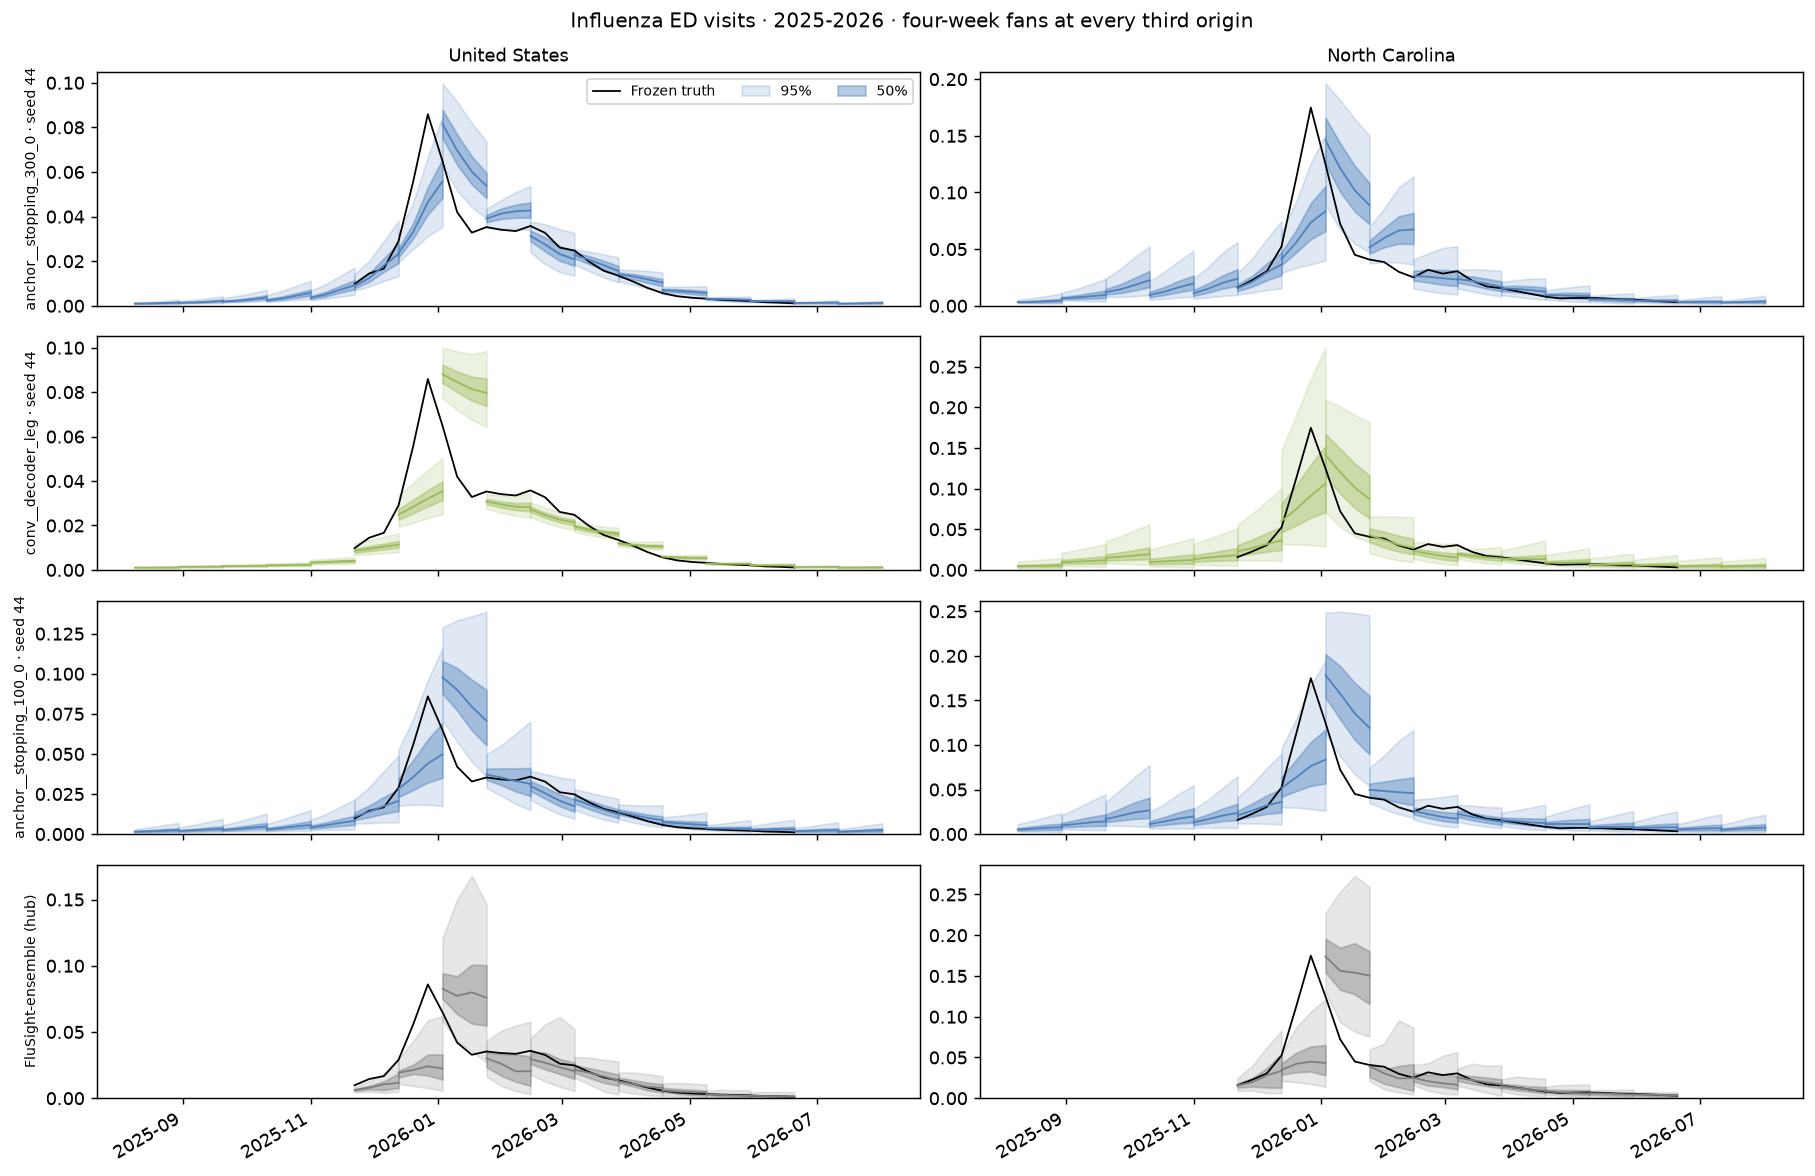
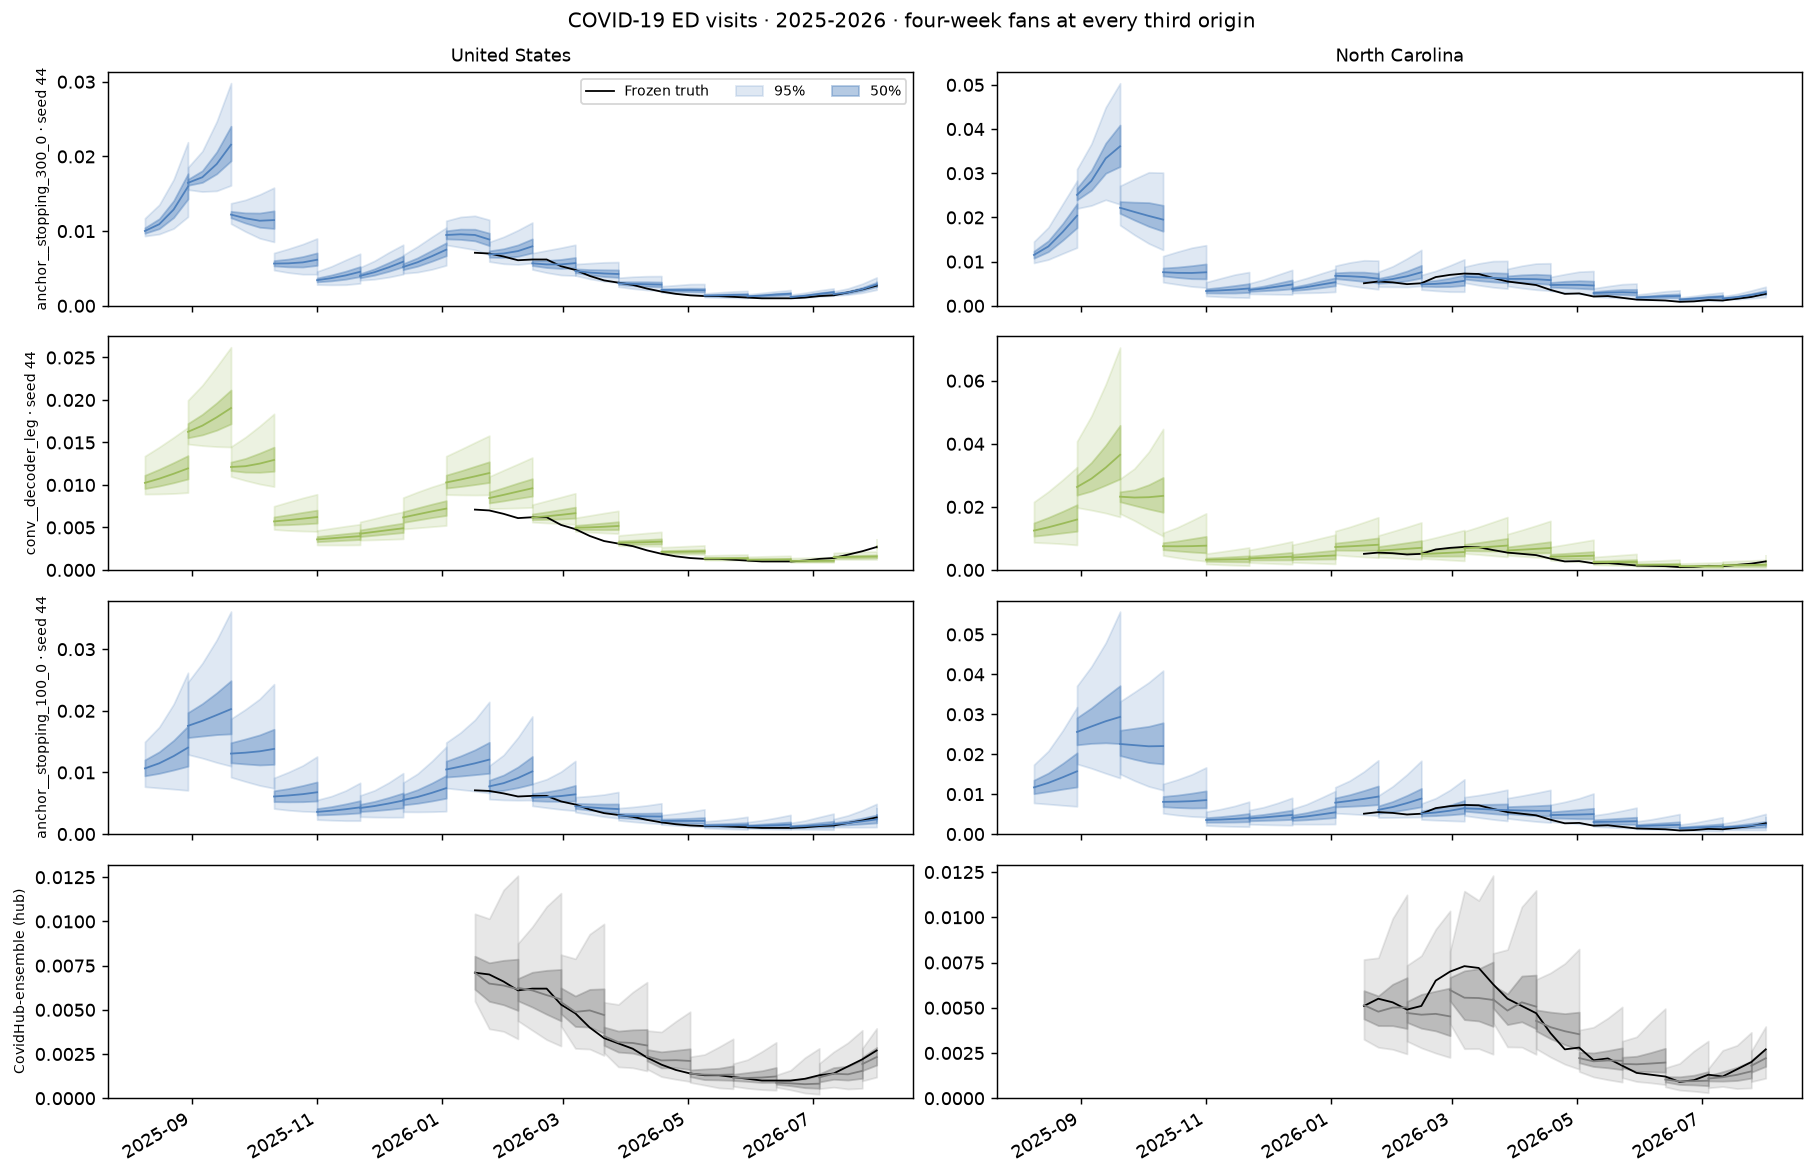
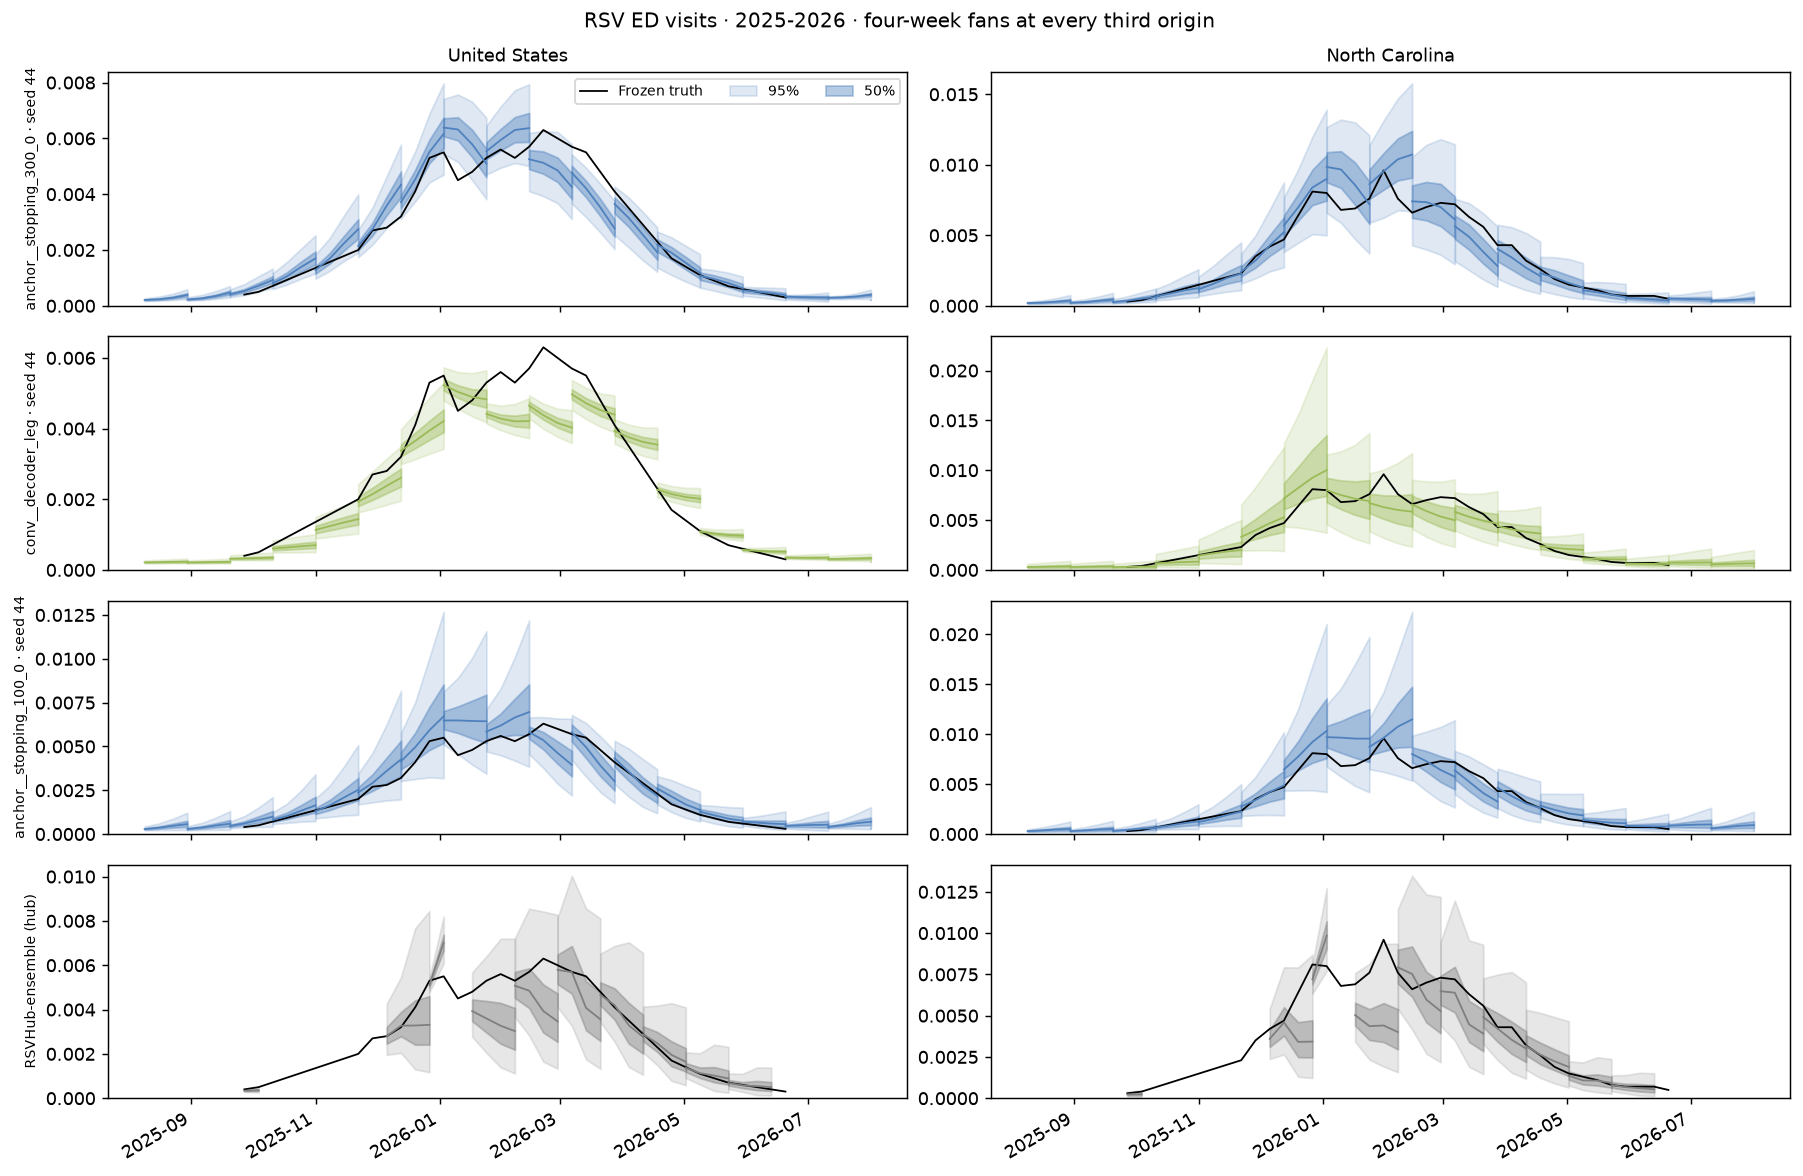
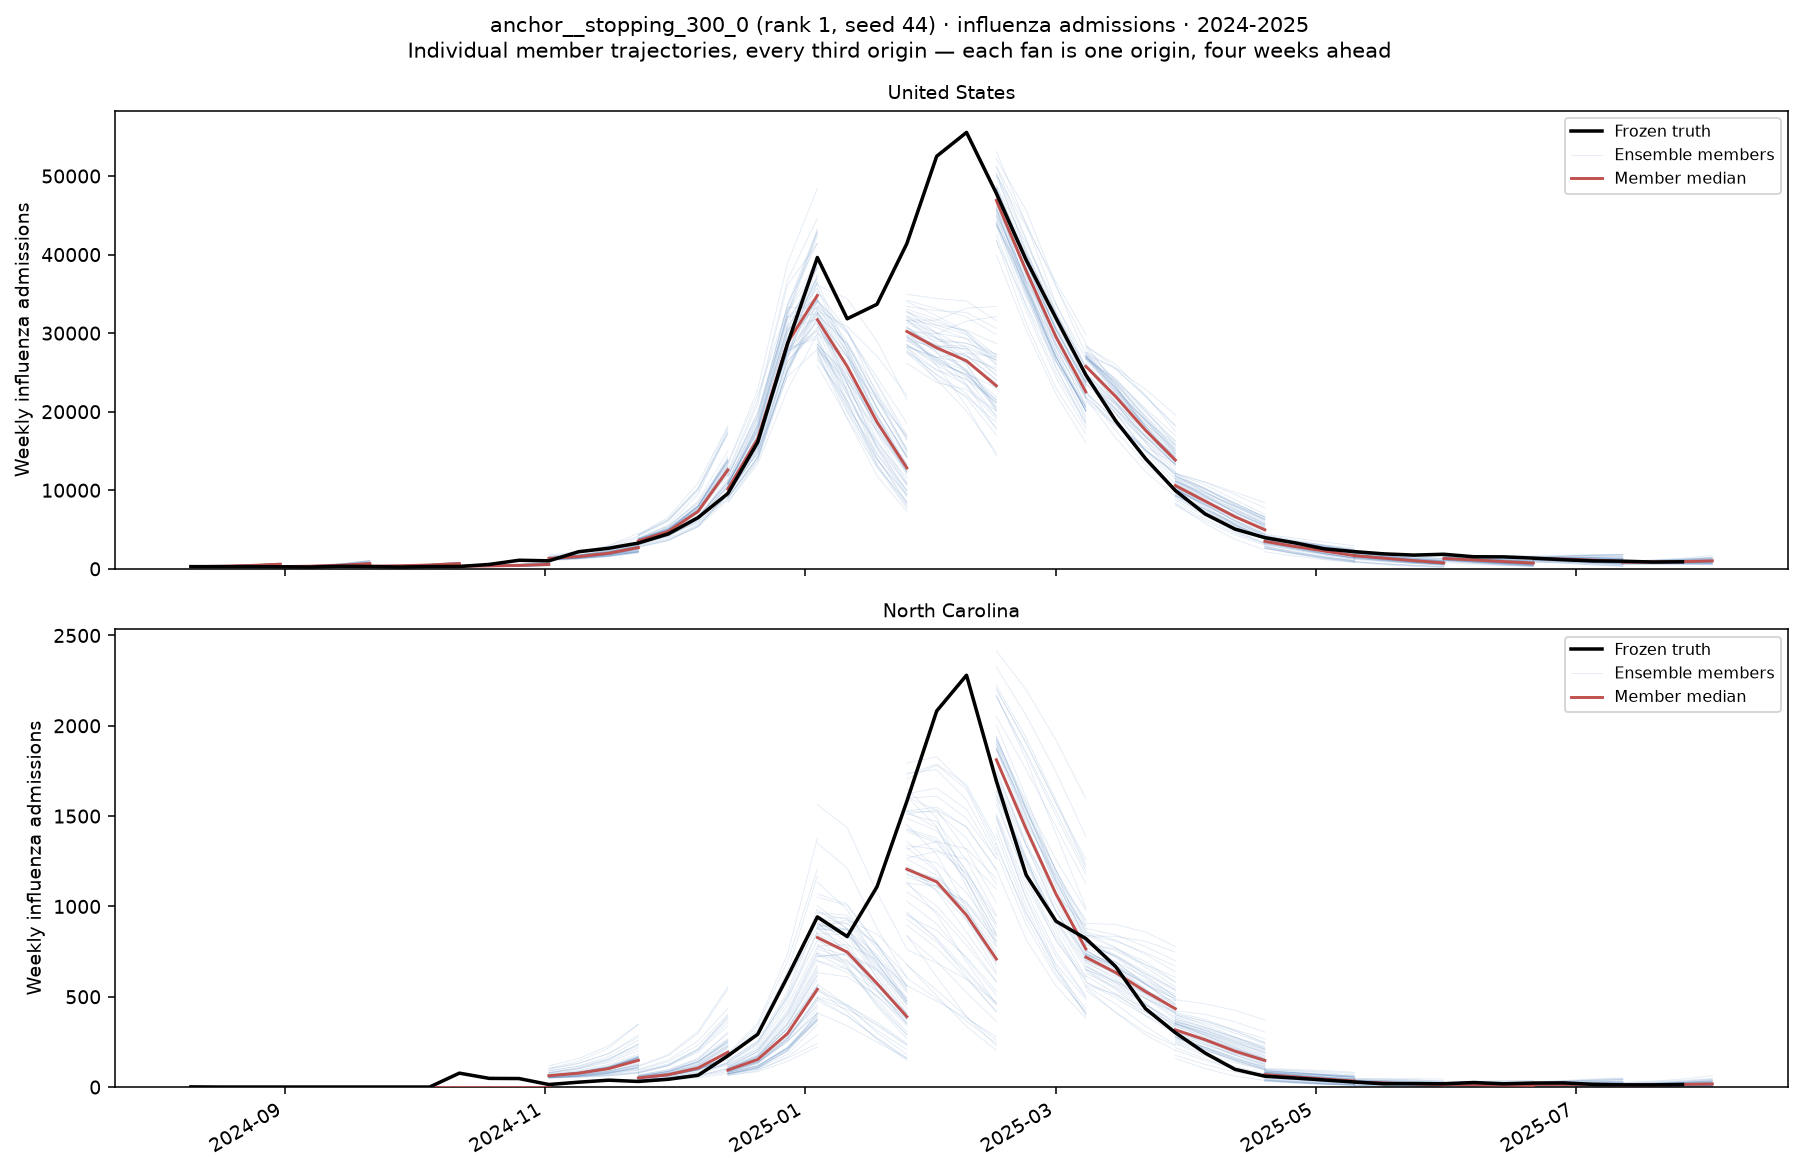
United States on the left, North Carolina on the right. Rows show the three leading configurations at their median-scoring seed (s44) and the hub ensemble. Every third forecast origin is drawn against frozen truth.
Member trajectories
50 of the rank-1 configuration's 100 saved members per origin:
Assumptions and limitations
- These are retrospective fits on finalized data, using NSSP values as truth. Earlier held-out seasons can have later seasons in their training set.
- All three seasons inform model selection; the ranking is not an independent evaluation of the selected model.
- Target coverage differs by season: 2023–2024 has influenza admissions only, 2024–2025 adds COVID admissions, and 2025–2026 has all six targets.
- Three seeds describe run-to-run variation. Their SD is not a significance threshold for differences between configurations.
- One-factor changes apply to their reference recipes; the suite does not estimate all interactions.
- Runs include mixed clean/dirty source states. The recorded review found no model-code differences; publication results need a clean rerun.
- This rewrite retains the reported numerical results; it does not recompute scores.
Reproducing
Historical ranking artifacts are in
data/experiments/b0-us-cross-4/ranking-2739af8db682/.
The plotting command uses that saved ranking:
Current scoring uses a different objective. See the postprocessing workflow and the B0.1 reproduction notes for rescoring. The follow-up design is in B0 after crosses: next steps.
Log
- 2026-09-15: Reran the suite after replacing pooled input scaling with
per-location scaling (
11a23ea). The legacy fit artifacts were deleted. - 2026-09-16: Shortened the report. Removed repeated analysis and explanations of overfitting, distribution shift and interval errors that the comparisons did not establish. Retained the historical score and figures.