Seasonal online nowcasting · October 1, 2026
Objective: improve reconstruction of the six NHSN/NSSP targets on a subsequent season. The primary development comparison is 2025–26; 2024–25 has limited archive support. These seasons have already been inspected during prior work, so they are development evidence, not an untouched prospective test. Forecast benefit requires a separate downstream forecasting comparison.
Model nowcasts versus observed revisions
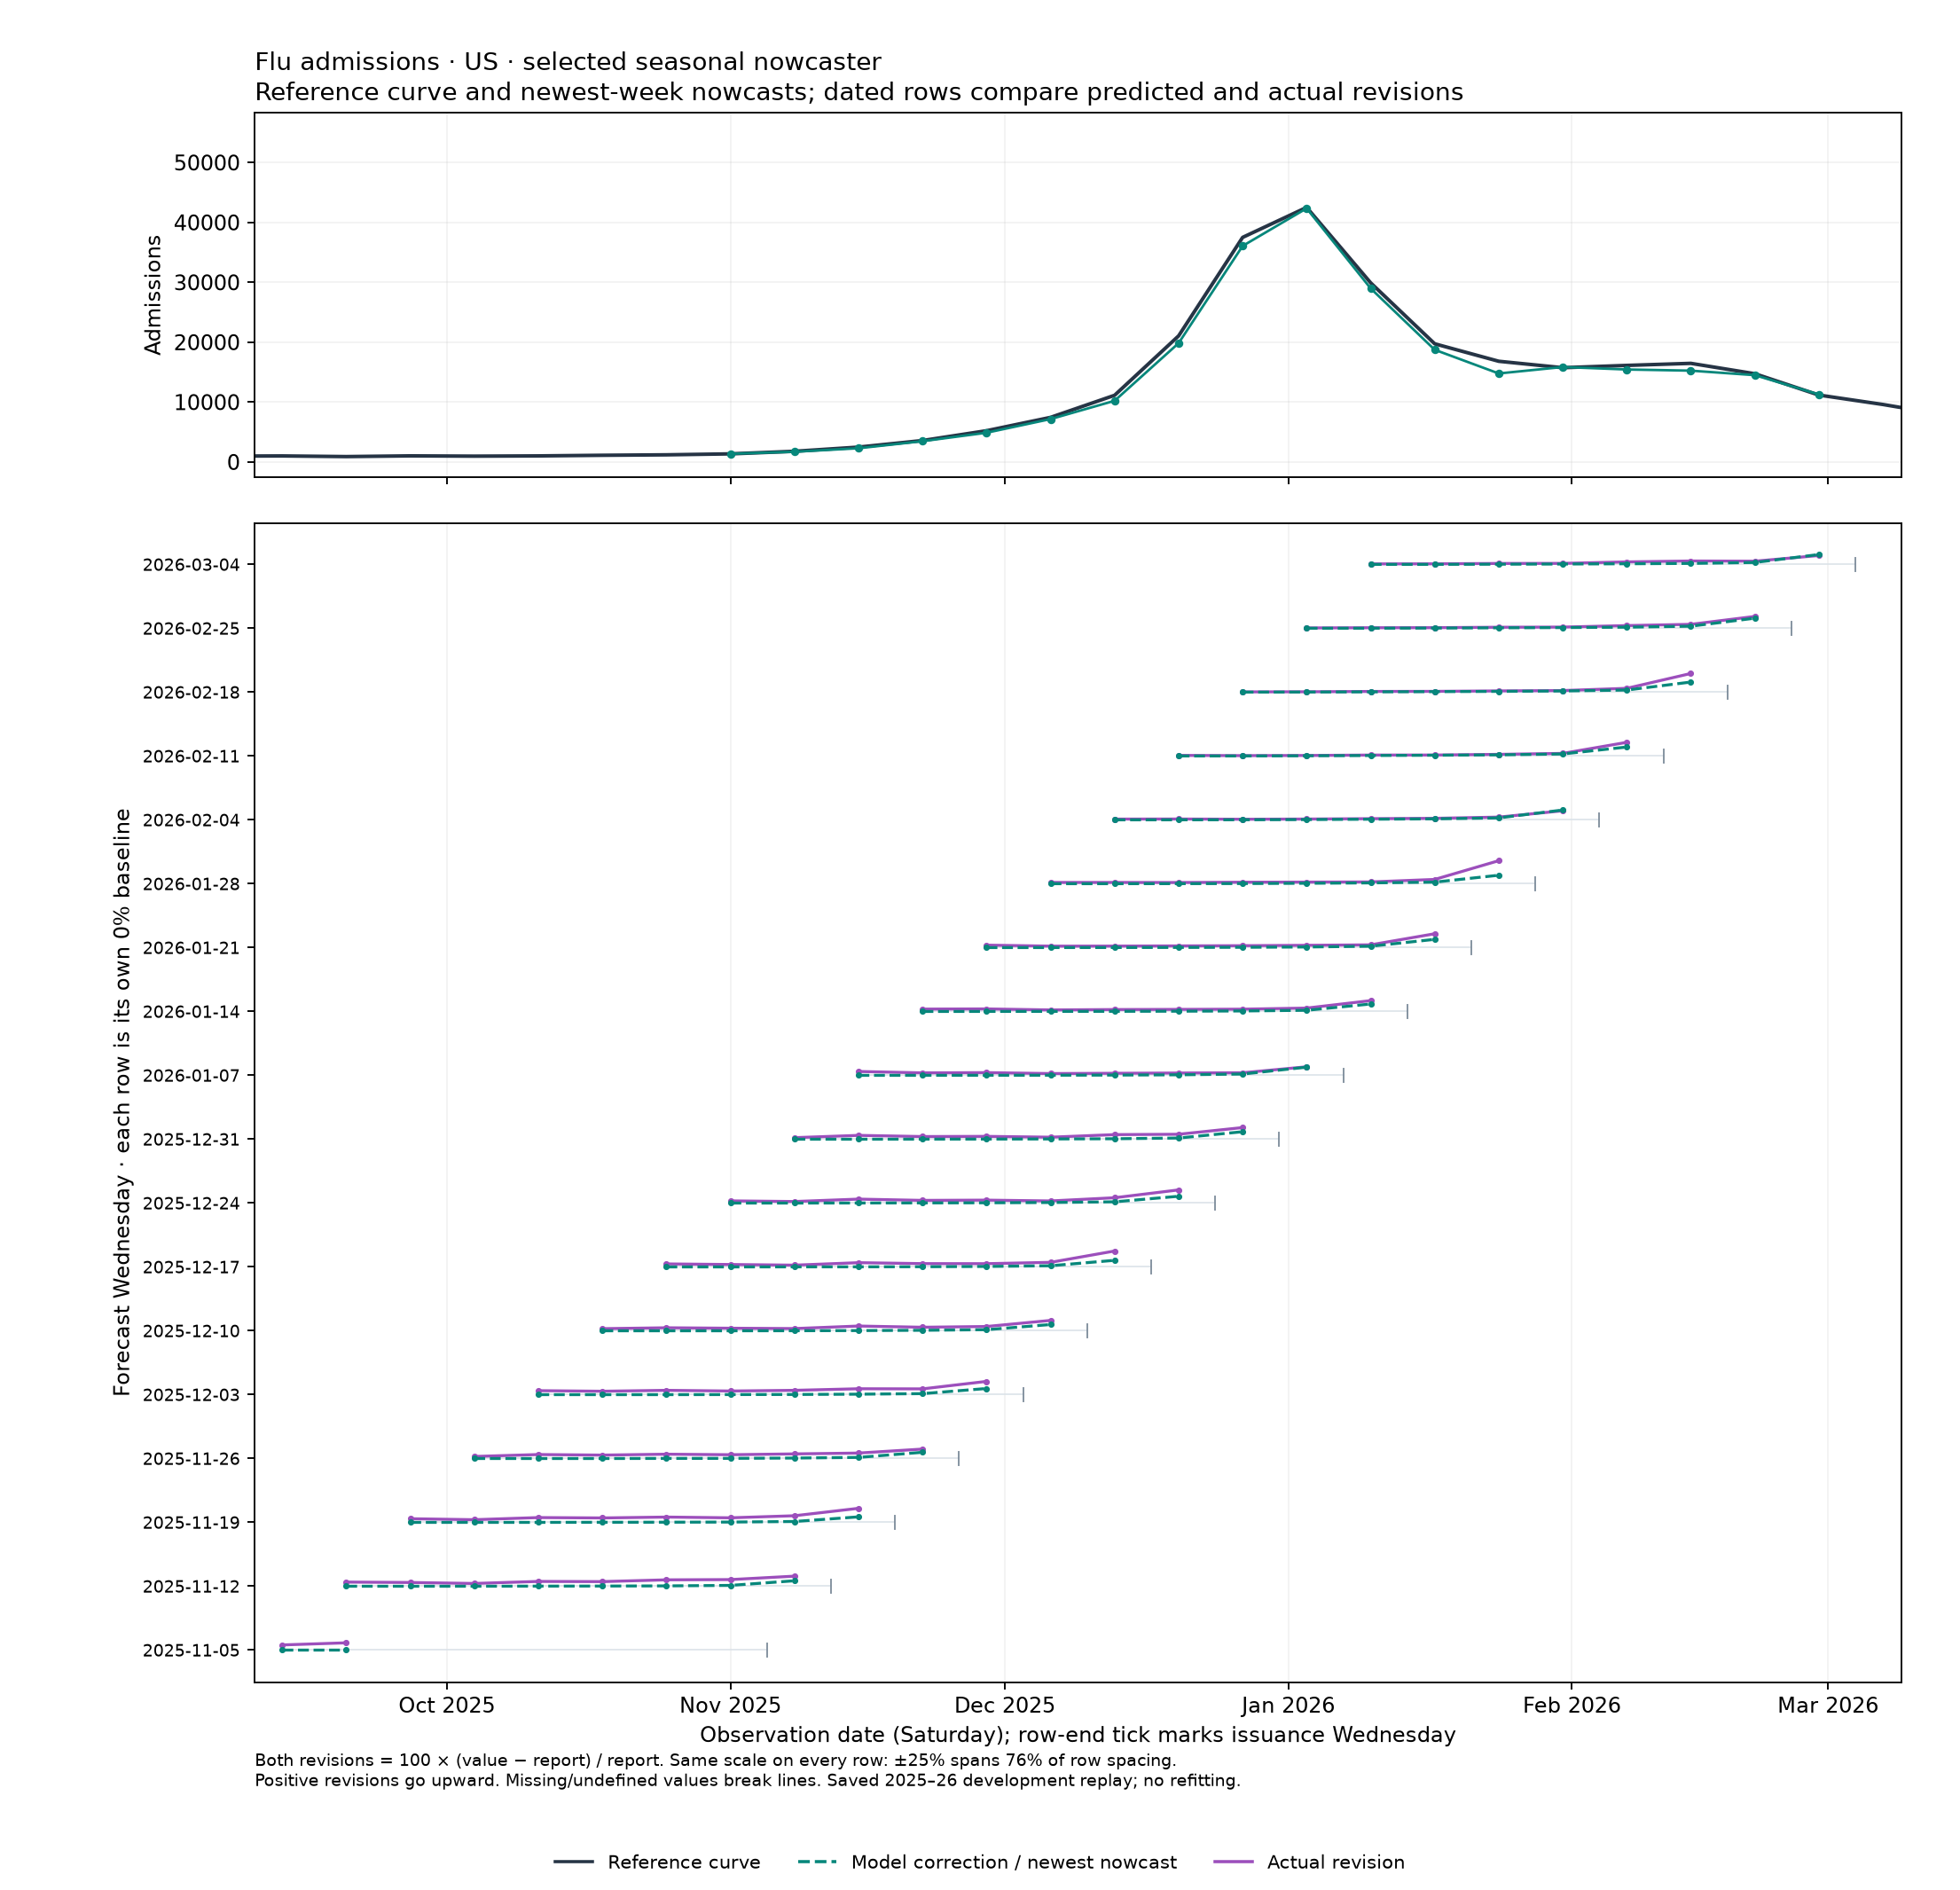
Open the dated-row visualizer full-size. Choose a target, location and Wednesday range. The upper panel shows the reference epidemic curve and newest-week model nowcasts. Below it, each Wednesday has its own vertical baseline; all points remain aligned to their Saturday observation dates. Purple is the actual subsequent revision, and dashed teal is the selected model's predicted revision. Their separation shows the correction error.
Both revisions default to 100 × (value − Wednesday report) / Wednesday report;
the denominator can instead be the frozen reference. Every row uses the same
linear percentage scale, with zero at its dated baseline and positive upward.
The row offsets encode issuance dates, not additional revision magnitude. Values
are never clipped or normalized separately by row. Both zero gives zero change;
other zero denominators and missing reports are undefined and break lines.
The curve above is in raw signal units on a separate vertical axis.
This view reads the completed selected model's 2025–26 seasonal replay, not a new fit. The saved model reconstructs eight weeks, so the selector spans two to eight weeks. Only saved evaluated cells have model/revision lines; an empty cell is not an inferred zero. The reference curve comes from the same hash-verified panel. The full-size view offers point details and CSV/PNG downloads. A static US flu example covers November–March.
Regenerate the visualization without fitting or scoring:
Result on the requested reporting conditions
The selected statistical model learns seasonal reporting-triangle development from the preceding two years and updates its factors every Wednesday. Robust weighted medians and partial pooling protect individual states from rare large revisions. It uses no neural network. All fitting completed on Longleaf.
Newest-week 2025–26 error, comparing the previous triangle model with the selected model on exactly the same observations:
| Reporting condition | US WAPE, previous → selected | State WAPE, previous → selected | State target-weeks |
|---|---|---|---|
| Complete visible 12-week history | 4.56% → 2.59% | 7.82% → 6.31% | 13,484 |
| Also eight uninterrupted reporting issuances | 4.51% → 2.28% | 7.51% → 5.98% | 10,215 |
WAPE is absolute error divided by observed total within each target, then averaged equally over the six targets. The state columns pool states within each target; they do not imply that every state is this accurate. Giving each location equal weight instead yields 8.78% → 7.29% and 8.49% → 6.98%, respectively. The equal-location fraction of positive observations individually within 5% improves from 56.0% to 63.5% with complete histories, and from 56.9% to 64.1% in the stricter group. National support is 267 and 202 target-weeks, respectively. The stricter group excludes about a quarter of reported observations, including reporting interruptions around holidays and outages.
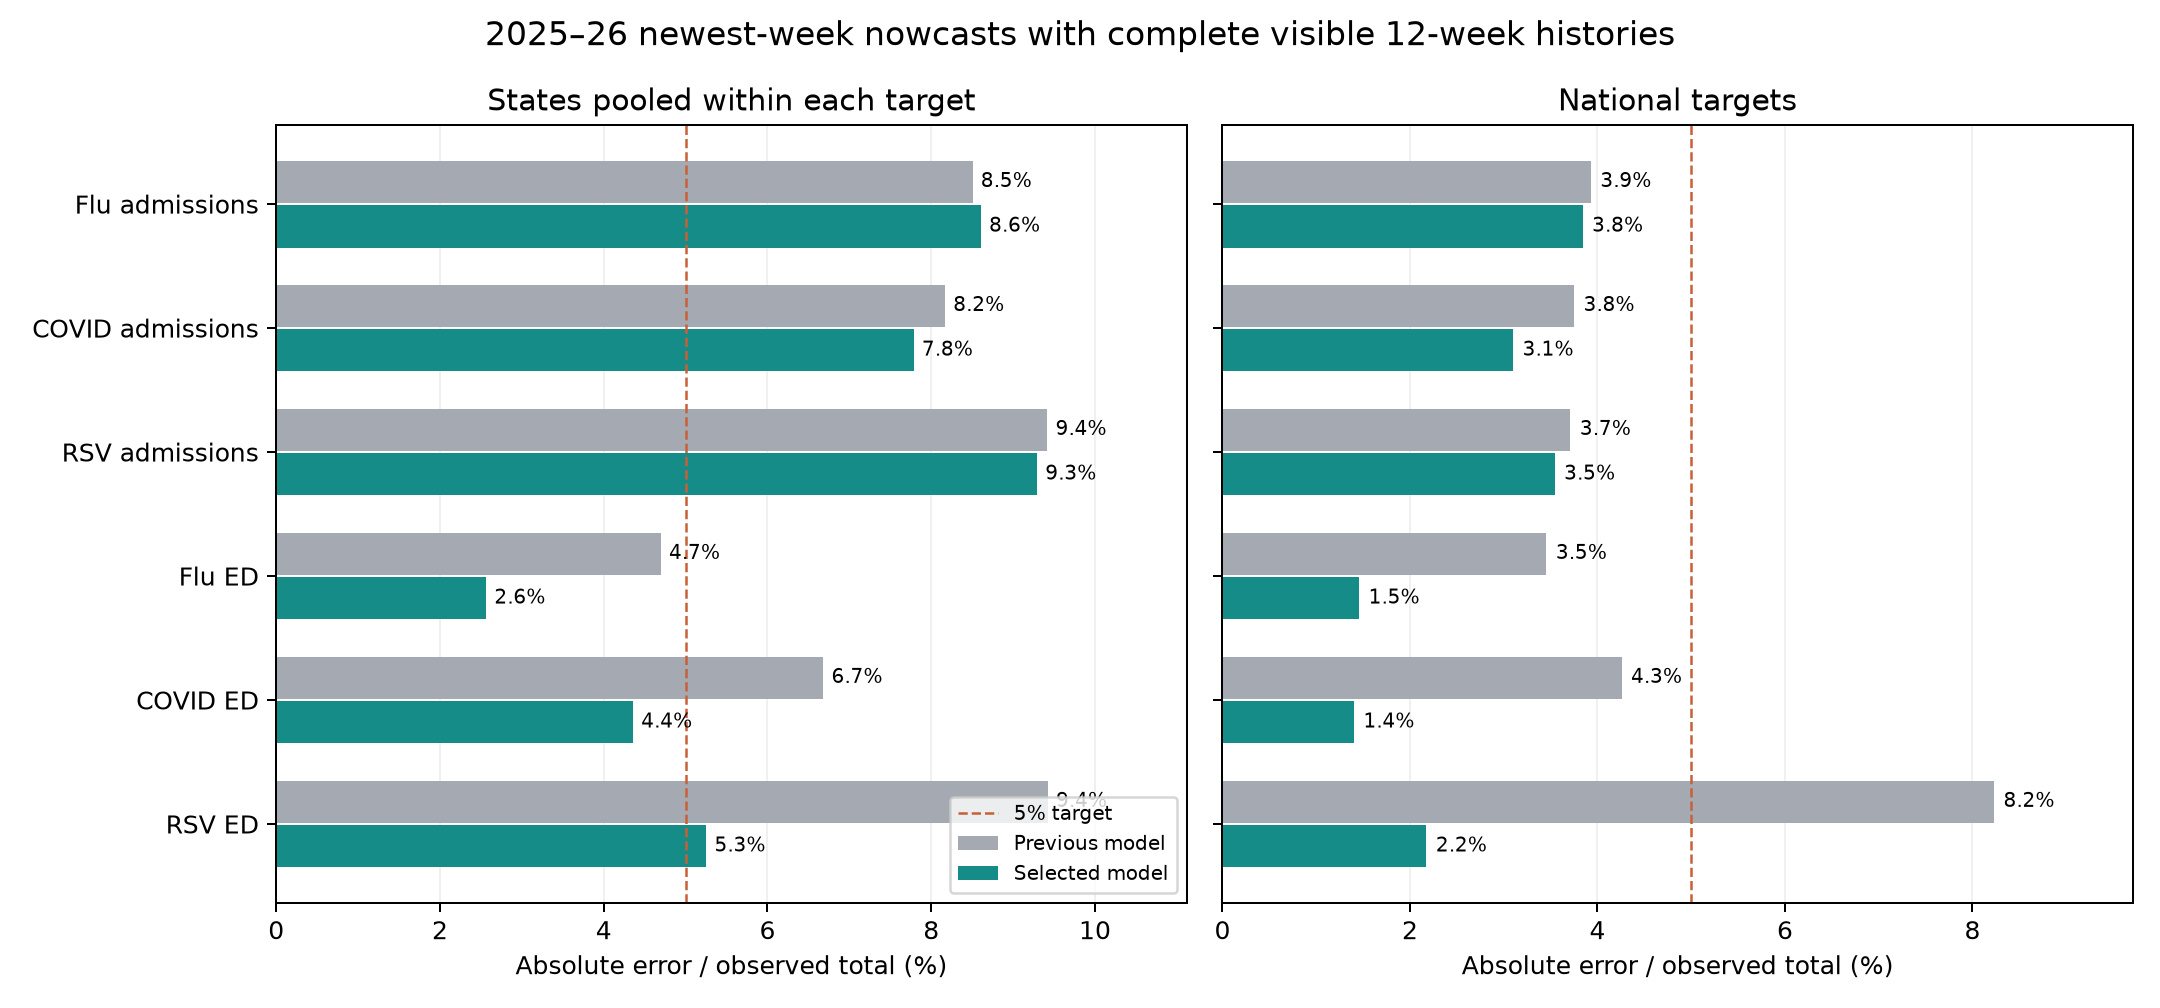
State ED WAPE improves from 4.70% to 2.56% for flu, 6.68% to 4.36% for COVID, and 9.42% to 5.25% for RSV. Admissions remain harder: COVID improves from 8.17% to 7.79%, RSV from 9.42% to 9.29%, and flu worsens slightly from 8.50% to 8.61%. The overall improvement therefore does not establish universal 5% accuracy.
A paired four-week block bootstrap over the full seasonal calendar gives a 19.3% reduction in state WAPE (95% resampling interval 14.3–22.0%) and 43.2% nationally (33.4–52.4%) for complete histories. These intervals describe within-season variability; they do not account for model selection or establish next-season generalization. See bootstrap estimates.
Across three recent rolling folds, complete-history WAPE averages 5.30% → 4.66% nationally and 9.33% → 8.92% for states. The older 2024–25 replay improves from 8.58% → 6.74% nationally and 9.71% → 8.36% for states, but covers only four targets and 55 national/2,720 state target-weeks. It is a limited-support check. No 2026–27 outcome or downstream forecasting benefit has been evaluated.
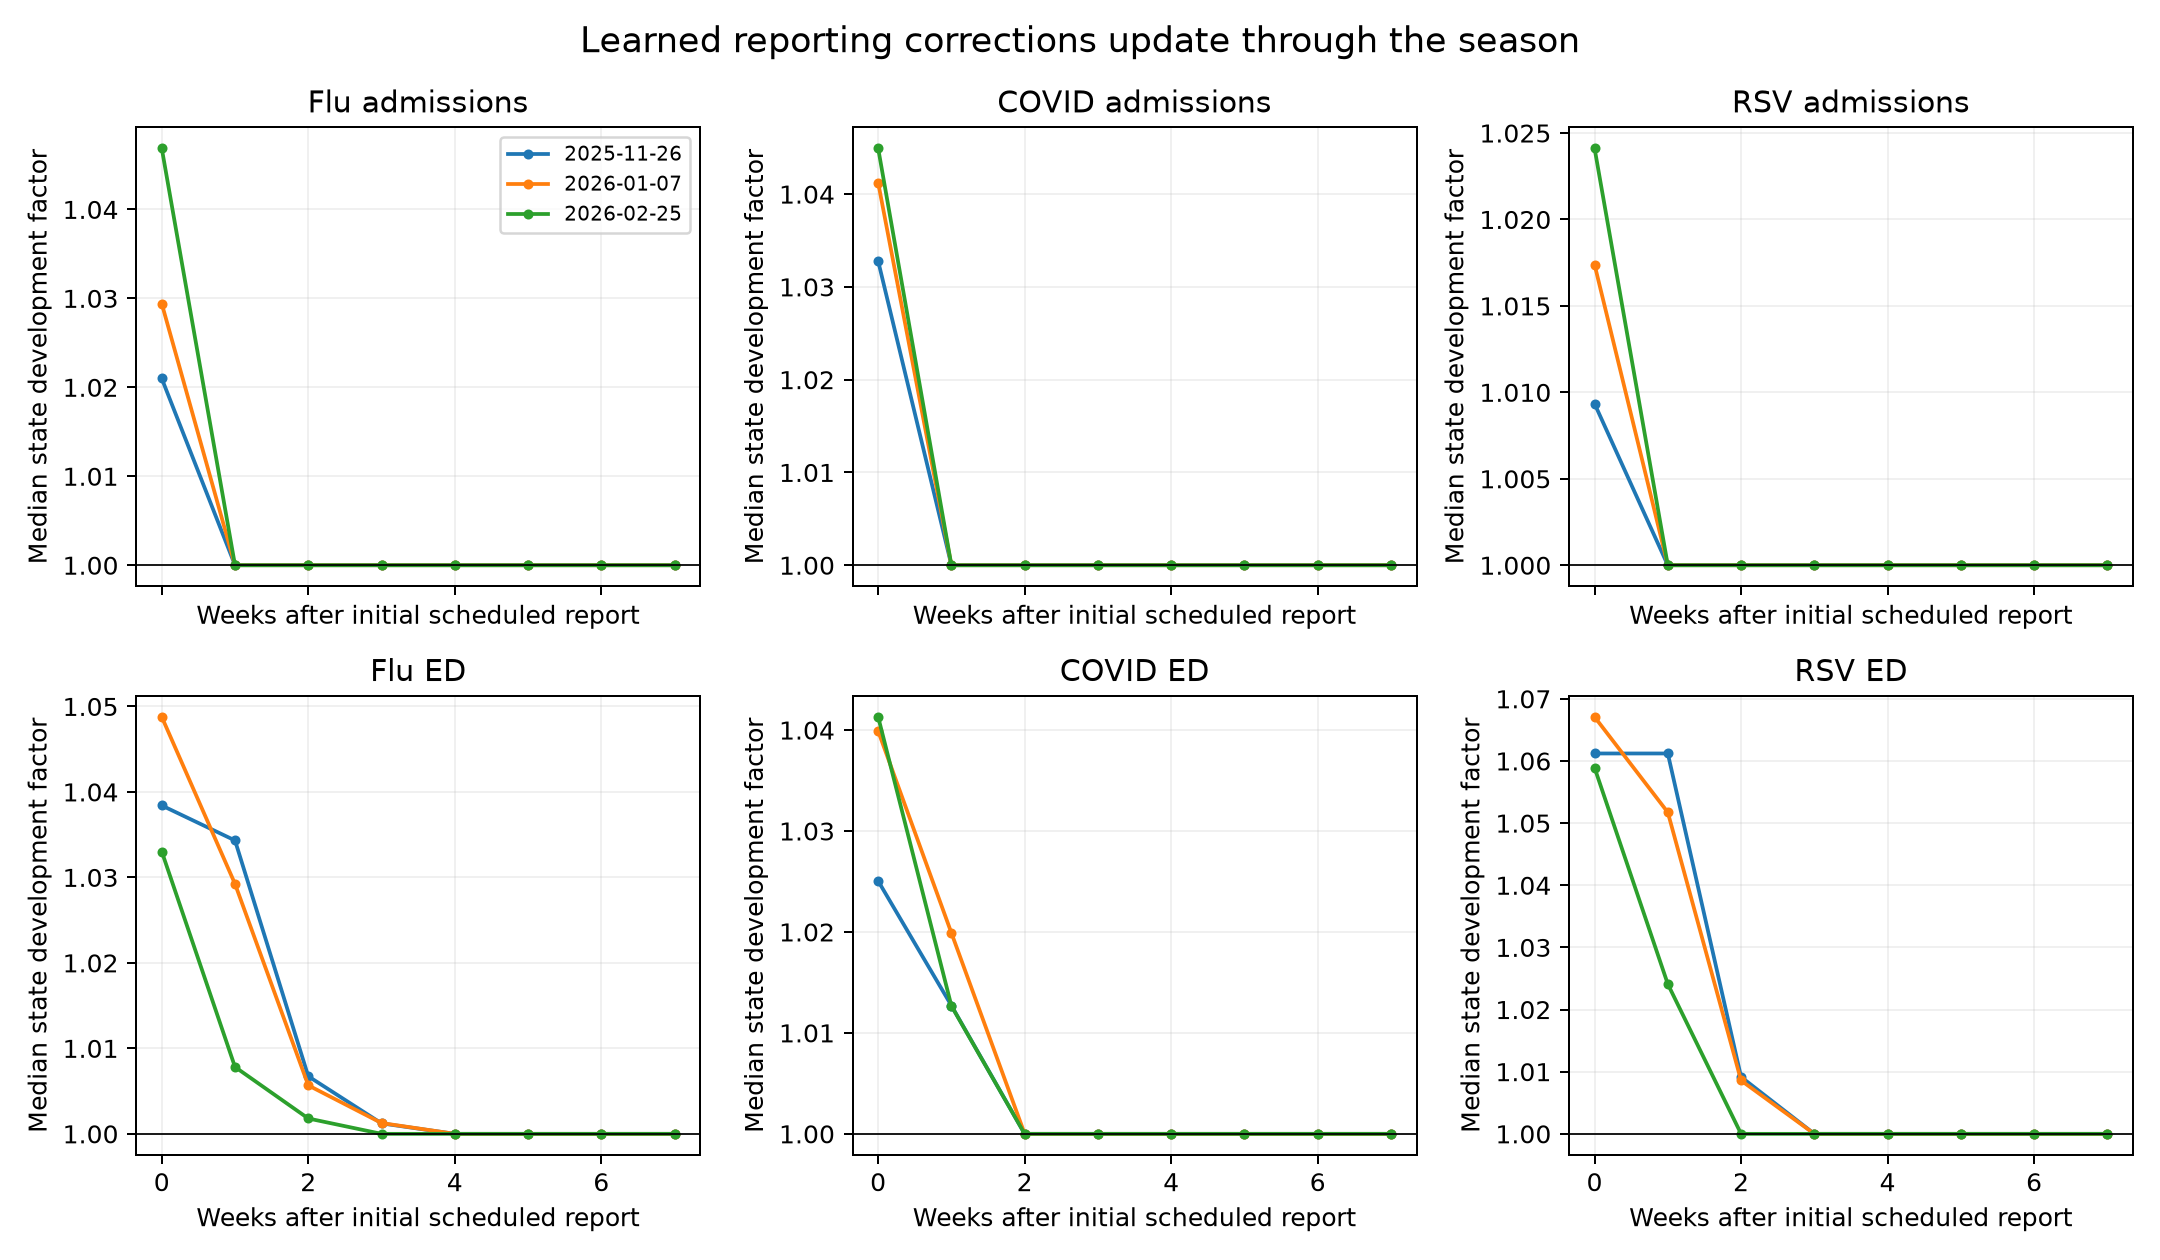
The learned curves are development corrections, not necessarily monotone delay probability distributions: the sources can revise downward. The central assumption is that nearby seasonal phases in the prior two years remain informative, while newly visible development pairs can adapt the curve during the current season. Delay 12 is treated as approximately mature; the source audit below quantifies the remaining revisions.
Primary evaluation: uninterrupted reporting
Following the user's clarification, missing-report accuracy is secondary. The primary criterion is newest-week reconstruction for a target/location with all 12 recent event weeks visible at the current issuance. This means that target's own history, not every unrelated covariate. A second check requires eight consecutive scheduled Wednesdays with an available newest-week report; it cannot be satisfied merely by subsequently backfilling an outage. We report the intersection too. All flags use current/past vintages only, never future gaps. Coverage is given by target and geography, since the stricter continuity group can exclude substantial portions of the season. All models share identical stratum membership. Missing-case improvements do not determine model choice.
Continuity summaries ·
Target scores and coverage (stable-target-scores.csv, removed 9 October 2026: over 1 MB) ·
Weekly continuity diagnostics.
Assumptions and protocol
- “Within 5%” means absolute error relative to the observed frozen reference. Report volume-weighted absolute percentage error (sum absolute error / sum observed), equal-location versions, and the proportion of nonzero observations individually within 5%. Zero observations have no defined relative error and are reported separately. Age zero is primary; ages 0–7 are also summarized.
- Scheduled Wednesday reports at delay 12 approximate mature observations. This is an assumption to audit against the frozen reference, not guaranteed finality. Corrections may be signed; development curves are not probability distributions when downward revisions occur.
- Prior-year reporting behavior is informative near the same seasonal phase. The seasonal kernel has eight-week standard deviation, a 104-week archive and a 52-week half-life. These are prespecified modeling choices for this sweep.
- Adaptive modes add a recency kernel with eight-week half-life since a pair became observable. Curves update each Wednesday with no future vintages.
- Direct seasonal/adaptive curves estimate delay d to delay 12. Adaptive-chain curves multiply d-to-d+1 factors, admitting recent partial triangles sooner.
- Mean-factor ablations use ratios of weighted cumulative totals; the selected model uses exposure-weighted medians of paired ratios. States borrow four effective weeks from the median of supported state factors (mean in mean-factor ablations). US is fitted independently and excluded from the shared curve. At least four local pairs are required; at least three states are required for a shared curve.
- NHSN uses a one-count offset; continuous sources have no offset. Outputs are nonnegative, respect source bounds and round reported NHSN counts.
- Selected predictions, including missing-cell predictions, use no later frozen reference labels or fitted reference shrinkage. Initial ridge-gap ablations used frozen reference labels with the documented four-week gap. Scoring normalization, support selection and comparator calibration retain the prior retrospective protocol. Model selection also uses the development outcomes.
- Seed 42 is a manager identifier; these estimators are deterministic. Training and scoring execute on Longleaf CPU allocations in the jlessler partition.
Manager commands
Run from /proj/jlessler/projects/tapestry-all/tapestry on Longleaf:
bash scripts/plan_seasonal_nowcast.sh seasonal-nowcast-v1-20261001
sbatch --job-name=seasonal-nowcast-v1-20261001 scripts/finalization.sbatch seasonal-nowcast-v1-20261001
.venv/bin/python -m chromantis.experiment.planner status -e seasonal-nowcast-v1-20261001
.venv/bin/python -m chromantis.experiment.planner rank -e seasonal-nowcast-v1-20261001
plan_seasonal_nowcast.sh calls the shared manager's plan with all three model
choices and both chronological protocols. The pinned v11 experiment supplies the
previous model comparison on matched cells. Every launch uses a new experiment
name so earlier results retain their code snapshot.
Missing-report iteration
The baseline's October–November 2025 target outage freezes late-September levels for six to seven weeks. This dominates newest-week all-cell errors for COVID. The second sweep changes target missing-value predictions only: extrapolate the last available value by the visible historical seasonal growth over the same gap one and two years earlier (weights 1 and 1/2). Historical levels use three-week means; combine growth in log space. A second version blends in a fitted log slope over the last six observed weeks, damping that slope toward the seasonal prior with a four-week timescale. The latest observation must be within 12 weeks; otherwise retain the existing fallback. NHSN uses a one-count offset. Weekly trend is bounded to doubling/halving and total growth to exp(±4). These are explicit regularization assumptions, not fitted parameters. No frozen reference labels enter either seasonal gap prediction. The comparison uses adaptive-chain reported corrections in both configurations and keeps ancillary gap models fixed.
bash scripts/plan_seasonal_nowcast.sh seasonal-nowcast-v2-20261001 gaps
sbatch --job-name=seasonal-nowcast-v2-20261001 scripts/finalization.sbatch seasonal-nowcast-v2-20261001
.venv/bin/python -m chromantis.experiment.planner status -e seasonal-nowcast-v2-20261001
.venv/bin/python -m chromantis.experiment.planner rank -e seasonal-nowcast-v2-20261001
Reporting-data audit
The current reference uses finalized CDC NHSN values where available. The vintage store remains unchanged. The audit CSV and figure below measure observed reports against this later reference; these are descriptive curves and are not estimator inputs. Delay-specific availability differs, so the points do not all use the same set of cells or event weeks. No missing report is counted as a zero. Rate totals are used as mathematical weights, not described as population counts. The CSV reports coverage at every delay.
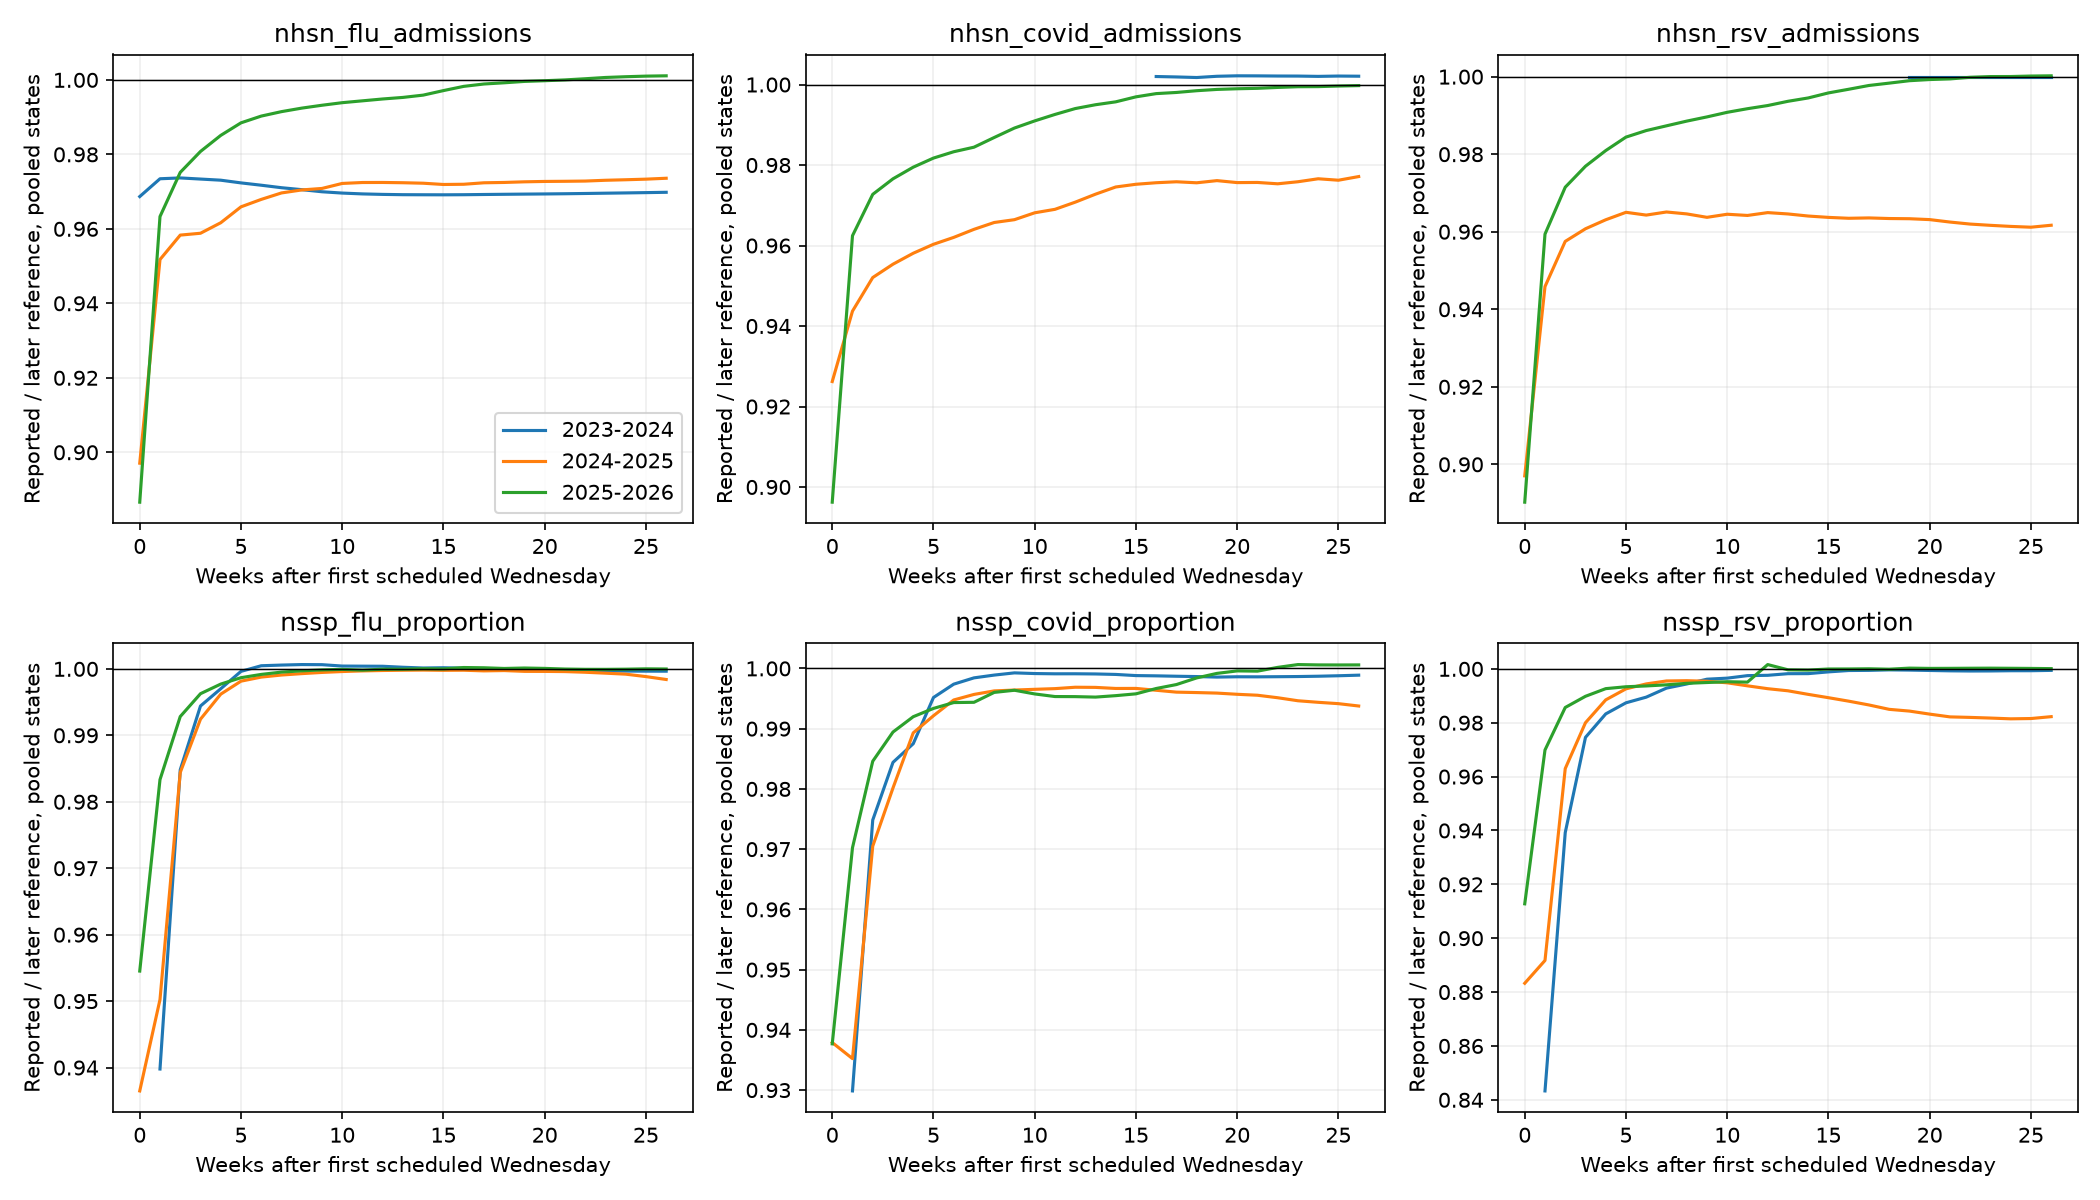
In 2025–26, reported newest-week NHSN values are 88.7–89.6% of the later reference in pooled states, with 10.8–11.8% absolute error. At delay 12 the absolute error is 0.68–0.93%. Thus the 12-week approximation is reasonably close in this season, while the 2024–25 NHSN residual is larger (2.94–4.60%). Historical reference changes and variable support mean these are not an irreducible prediction-error floor.
October 1 log: implemented three causal seasonal curves and submitted Longleaf job 3307564. Retained the existing gap component for that ablation. Two focused scientific checks verify future-vintage isolation, rate scaling, and exact seasonal extrapolation on a known exponential signal.
October 1 log: submitted the two gap variants as Longleaf job 3308526. For the final report, use a four-week moving-block bootstrap jointly over all six targets (2,000 replicates, fixed seed 42). This quantifies within-season uncertainty on reused development data; it does not validate another season.
Proxy-growth iteration and faster updating
Direct annual NHSN gap growth is rejected: sparse historical counts can generate very large ratios around the prior year's reporting transition. The second sweep's seasonal-gap result is a failed candidate, not a recommended model.
The third sweep instead anchors each missing target to its last local report and transports the national growth of a related, actually visible signal:
- Flu and COVID: current outpatient claims, using trailing two-week means at the target week and last observed target week. A report at the target week is required; stale claims are not labeled contemporaneous.
- RSV: current national NSSP RSV when available; otherwise three-week-smoothed prior-year NSSP RSV seasonal growth. This avoids near-zero NHSN counts around historical changes in reporting support.
- If no supported proxy exists, use a recent national target log slope over three weeks, damped over four weeks. Growth is limited to exp(±0.35 × gap weeks). With no target observation within 12 weeks, use the median of up to 104 older visible observations; with no visible history, use zero.
Assumptions: national relative growth transfers approximately to each state's anchored level; claims track flu/COVID target growth; ED RSV seasonality informs RSV admissions; source revisions can affect proxy growth. These are mechanistic modeling assumptions, not established source equivalences. All proxies are read from the issuance vintage; frozen labels never enter the growth estimate. The final proxy formulation removes the old reference-based no-history fallback. Evaluation support and normalized-error scales retain the retrospective qualification above. No zero is substituted for an absent proxy.
This sweep compares recency half-lives 8/2/4/8 weeks with state pooling strengths 4/1/1/0 effective weeks. Seasonal bandwidth remains eight weeks. It evaluates only the six targets to speed iteration; scoring support for those targets is unchanged. Latest curves still update every Wednesday, including during the held-out season as reports become available. Such updating is intentional.
bash scripts/plan_seasonal_nowcast.sh seasonal-nowcast-v3-20261001 tuning
sbatch --job-name=seasonal-nowcast-v3-20261001 scripts/finalization.sbatch seasonal-nowcast-v3-20261001
.venv/bin/python -m chromantis.experiment.planner status -e seasonal-nowcast-v3-20261001
.venv/bin/python -m chromantis.experiment.planner rank -e seasonal-nowcast-v3-20261001
The manager now writes finalization-ranking/target-performance.csv and
target-ranking.csv for newest-week absolute-relative diagnostics, separately
for states and national targets. wape weights observations by their reference
value within each signal and geography; location_wape instead averages each
location's WAPE equally. Summary rows give each supported target equal weight.
within5 averages positive-reference hit fractions equally across locations;
zero-valued observations have no relative-error denominator.
Robust-factor check
The mean-factor candidates improve aggregate absolute error, but reduce the fraction of small state observations individually within 5%. The fourth sweep therefore compares exposure-weighted medians with means. A weighted median fits absolute loss to paired report ratios, with the same seasonal/recency weights and local pseudo-exposure. Shared factors use the median of supported state factors, excluding US. The sweep checks the eight-week/four-prior-week setting and a two-week/one-prior-week setting, with the proxy gap component held fixed. This is an additional development-data comparison, not a fresh validation set.
bash scripts/plan_seasonal_nowcast.sh seasonal-nowcast-v4-20261001 robust
sbatch --job-name=seasonal-nowcast-v4-20261001 scripts/finalization.sbatch seasonal-nowcast-v4-20261001
.venv/bin/python -m chromantis.experiment.planner status -e seasonal-nowcast-v4-20261001
.venv/bin/python -m chromantis.experiment.planner rank -e seasonal-nowcast-v4-20261001
Selected reproducible configuration
Use seasonal-nowcast-causal-20261001: adaptive weekly development, weighted
medians, a 104-week archive, eight-week seasonal bandwidth, eight-week recent-pair
half-life, four effective prior weeks for states, and independent national fits.
Keep proxy-growth outage bridging, and round NSSP point outputs to the observed
0.0001 proportion grid. The grid is verified against every finite stored NSSP
vintage and reference value, allowing float32 representation error. No existing
forecast configuration is silently replaced by this finalizer.
Rounding is also applied to the median-revision and baselinenowcast point
comparators. The latter is labeled baselinenowcast_point_v2_nssp_grid in the
saved metadata. Re-rounding the previous model changes its 2025–26 newest-week
state macro WAPE by less than 0.001 percentage point; the principal comparison
therefore does not obtain its improvement merely by rounding the new model.
NHSN reported predictions keep their existing integer resolution.
bash scripts/plan_seasonal_nowcast.sh seasonal-nowcast-causal-20261001 selected
sbatch --job-name=seasonal-nowcast-causal-20261001 scripts/finalization.sbatch seasonal-nowcast-causal-20261001
.venv/bin/python -m chromantis.experiment.planner status -e seasonal-nowcast-causal-20261001
.venv/bin/python -m chromantis.experiment.planner rank -e seasonal-nowcast-causal-20261001
The same planner can be called directly for the seasonal configuration:
.venv/bin/python -m chromantis.experiment.planner plan \
  -e seasonal-nowcast-causal-20261001 \
  -s 'task=finalize,input_mode=vintaged,lookback=12,finalization_weeks=8,finalization_model=adaptive_chain,finalization_gap=proxy,finalization_scope=targets,finalization_statistic=median,finalization_quantize=1,finalization_cv=season,evaluation_seasons=recent_two' \
  --seeds 42 --device cpu
Use the wrapper above when both seasonal and rolling configurations are wanted.
status prints the exact resubmission command if interrupted. plan is for a
fresh run and refreshes its pinned code snapshot; do not re-plan during fitting.
Scientific validation: focused tests cover causal vintage access, invariance to future reference changes, rate scaling, known seasonal growth, robustness to rare revision spikes, and percentage-error denominators with zero labels excluded from the 5% hit fraction. Figures are generated for user inspection, not visually reviewed by the agent.
Final causality audit
The first selected run (job 3312259) exposed a legacy reference-median fallback
in 182 scored cells across all eight ages, including 26 newest-week state cells
in 2025–26. All involved sparse NSSP history. That fallback was removed from the
proxy model: beyond a 12-week gap, use the median of up to 104 actually visible
historical values, or zero when none exists. This is a conservative explicit
assumption for unsupported locations, not a claim of a learned accurate value.
A focused test changes the supplied reference fallback from zero to one billion
and verifies identical predictions with both sparse and entirely absent history.
The corrected model completed under seasonal-nowcast-causal-20261001, job
3313781: both configurations and all five folds finished. Evaluation-only
continuity scoring completed in job 3315529 without refitting. Pinned seasonal
and rolling runs are mlp-all-vintaged-ed46d3e36e5f/s42/attempt-001 and
mlp-all-vintaged-d4567dbbc8b8/s42/attempt-001. Local and Longleaf panel SHA-256
matched: 54d0e3306a76ded067c6d1b65493d50b1c19bde2e66ab80a438674ec37e6c80f.
The final target curves, gap predictions and long-gap fallback do not use frozen reference labels. Frozen labels still determine retrospective scoring support, normalization scales and comparator calibration. Model/hyperparameter selection used these development seasons. The report therefore does not claim an untouched prospective evaluation, calibrated predictive intervals, or downstream forecast improvement. A delay-development factor is a signed-revision point correction, not necessarily a monotone probability CDF.
Decision log: jobs 3307564, 3308526, 3309863 and 3310934 evaluated seasonal curves, outage extrapolation, adaptation/pooling, and robust median factors respectively. Rejected direct seasonal NHSN outage ratios and the mean-factor tradeoff; chose the slower median update because faster settings brought no persuasive overall gain. The source is kept simple and deterministic; no new dependency or neural network is introduced.
Reproduce the report
After syncing completed experiment artifacts from Longleaf, generate tables and figures locally (these commands do not fit any model):
.venv/bin/python docs/experiments/seasonal-nowcast-20261001/report.py \
  data/experiments/reporting-triangle-v11-20261001 \
  data/experiments/seasonal-nowcast-v1-20261001 \
  data/experiments/seasonal-nowcast-v2-20261001 \
  data/experiments/seasonal-nowcast-v3-20261001 \
  data/experiments/seasonal-nowcast-v4-20261001 \
  data/experiments/seasonal-nowcast-causal-20261001
.venv/bin/python docs/experiments/seasonal-nowcast-20261001/selected_report.py \
  'adaptive_chain+proxy+statistic=median+quantize=1'
.venv/bin/python docs/experiments/seasonal-nowcast-20261001/maturity_audit.py
All model summaries · Target-level diagnostics (target-scores.csv, removed 9 October 2026: over 1 MB) ·
Selected target scores ·
Four-week block bootstrap ·
Weekly errors · Learned factors (learned-curves.csv.gz, removed 9 October 2026: over 1 MB).
The manager's target-ranking files now include stratum: all, reported,
complete_history_12, uninterrupted_8, and complete_and_uninterrupted.
Existing fitted artifacts can be rescored without retraining. The frozen source
snapshot preserves fitting code; the current manager adds these evaluation-only
strata from the same pinned panel.
.venv/bin/python docs/experiments/seasonal-nowcast-20261001/stable_report.py \
  data/experiments/reporting-triangle-v11-20261001 \
  data/experiments/seasonal-nowcast-v1-20261001 \
  data/experiments/seasonal-nowcast-v3-20261001 \
  data/experiments/seasonal-nowcast-v4-20261001 \
  data/experiments/seasonal-nowcast-causal-20261001
A scientific check distinguishes a currently complete backfilled history from uninterrupted historical reporting, preventing outage recovery from being misclassified as a long period without missing reports.