State-level Emergency Department Visits (NSSP)
-
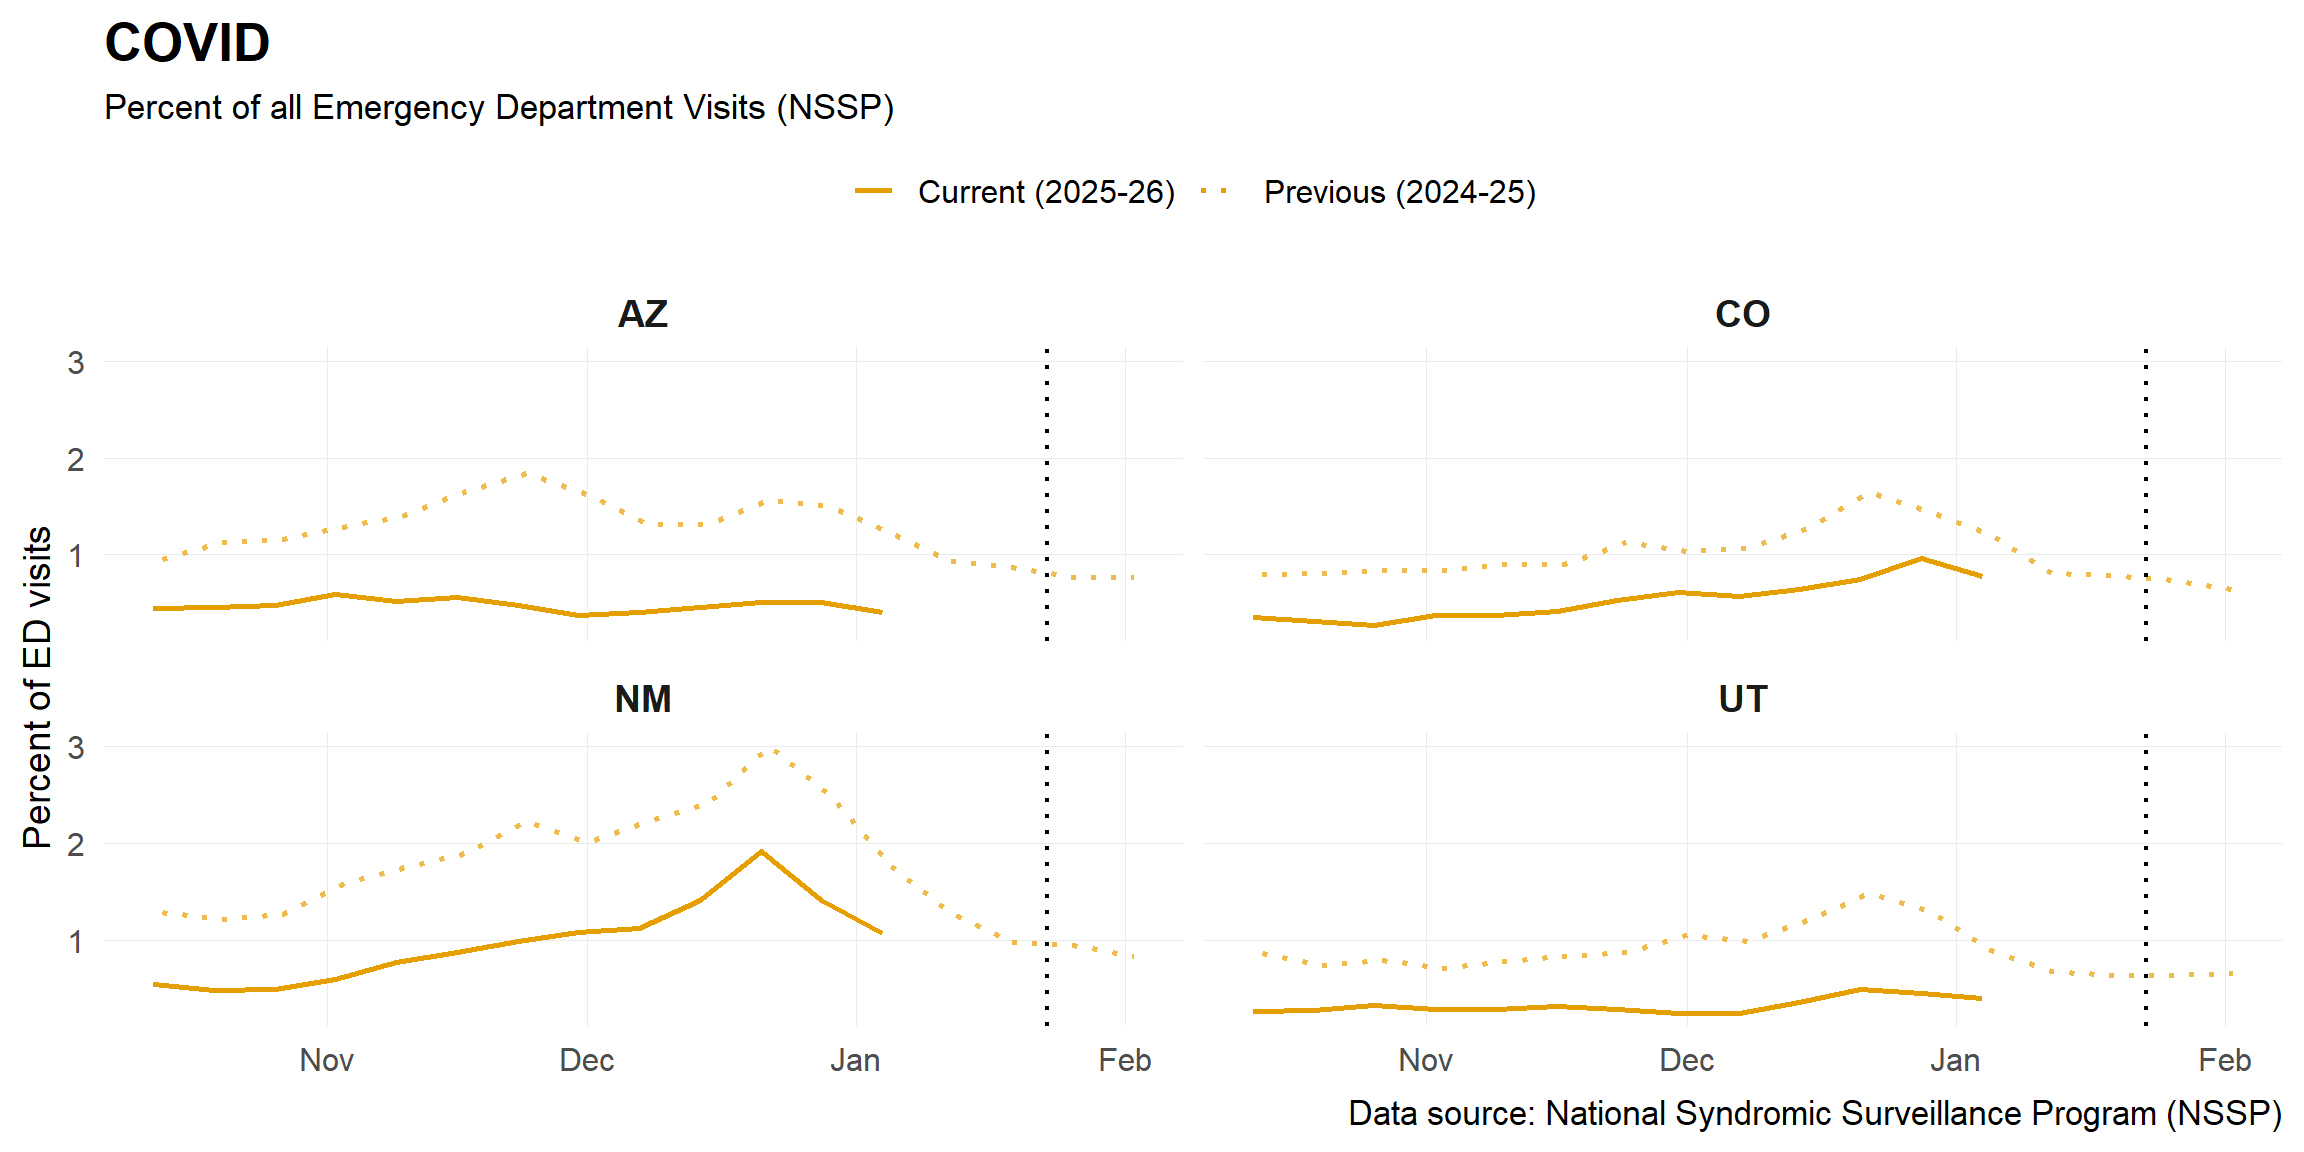
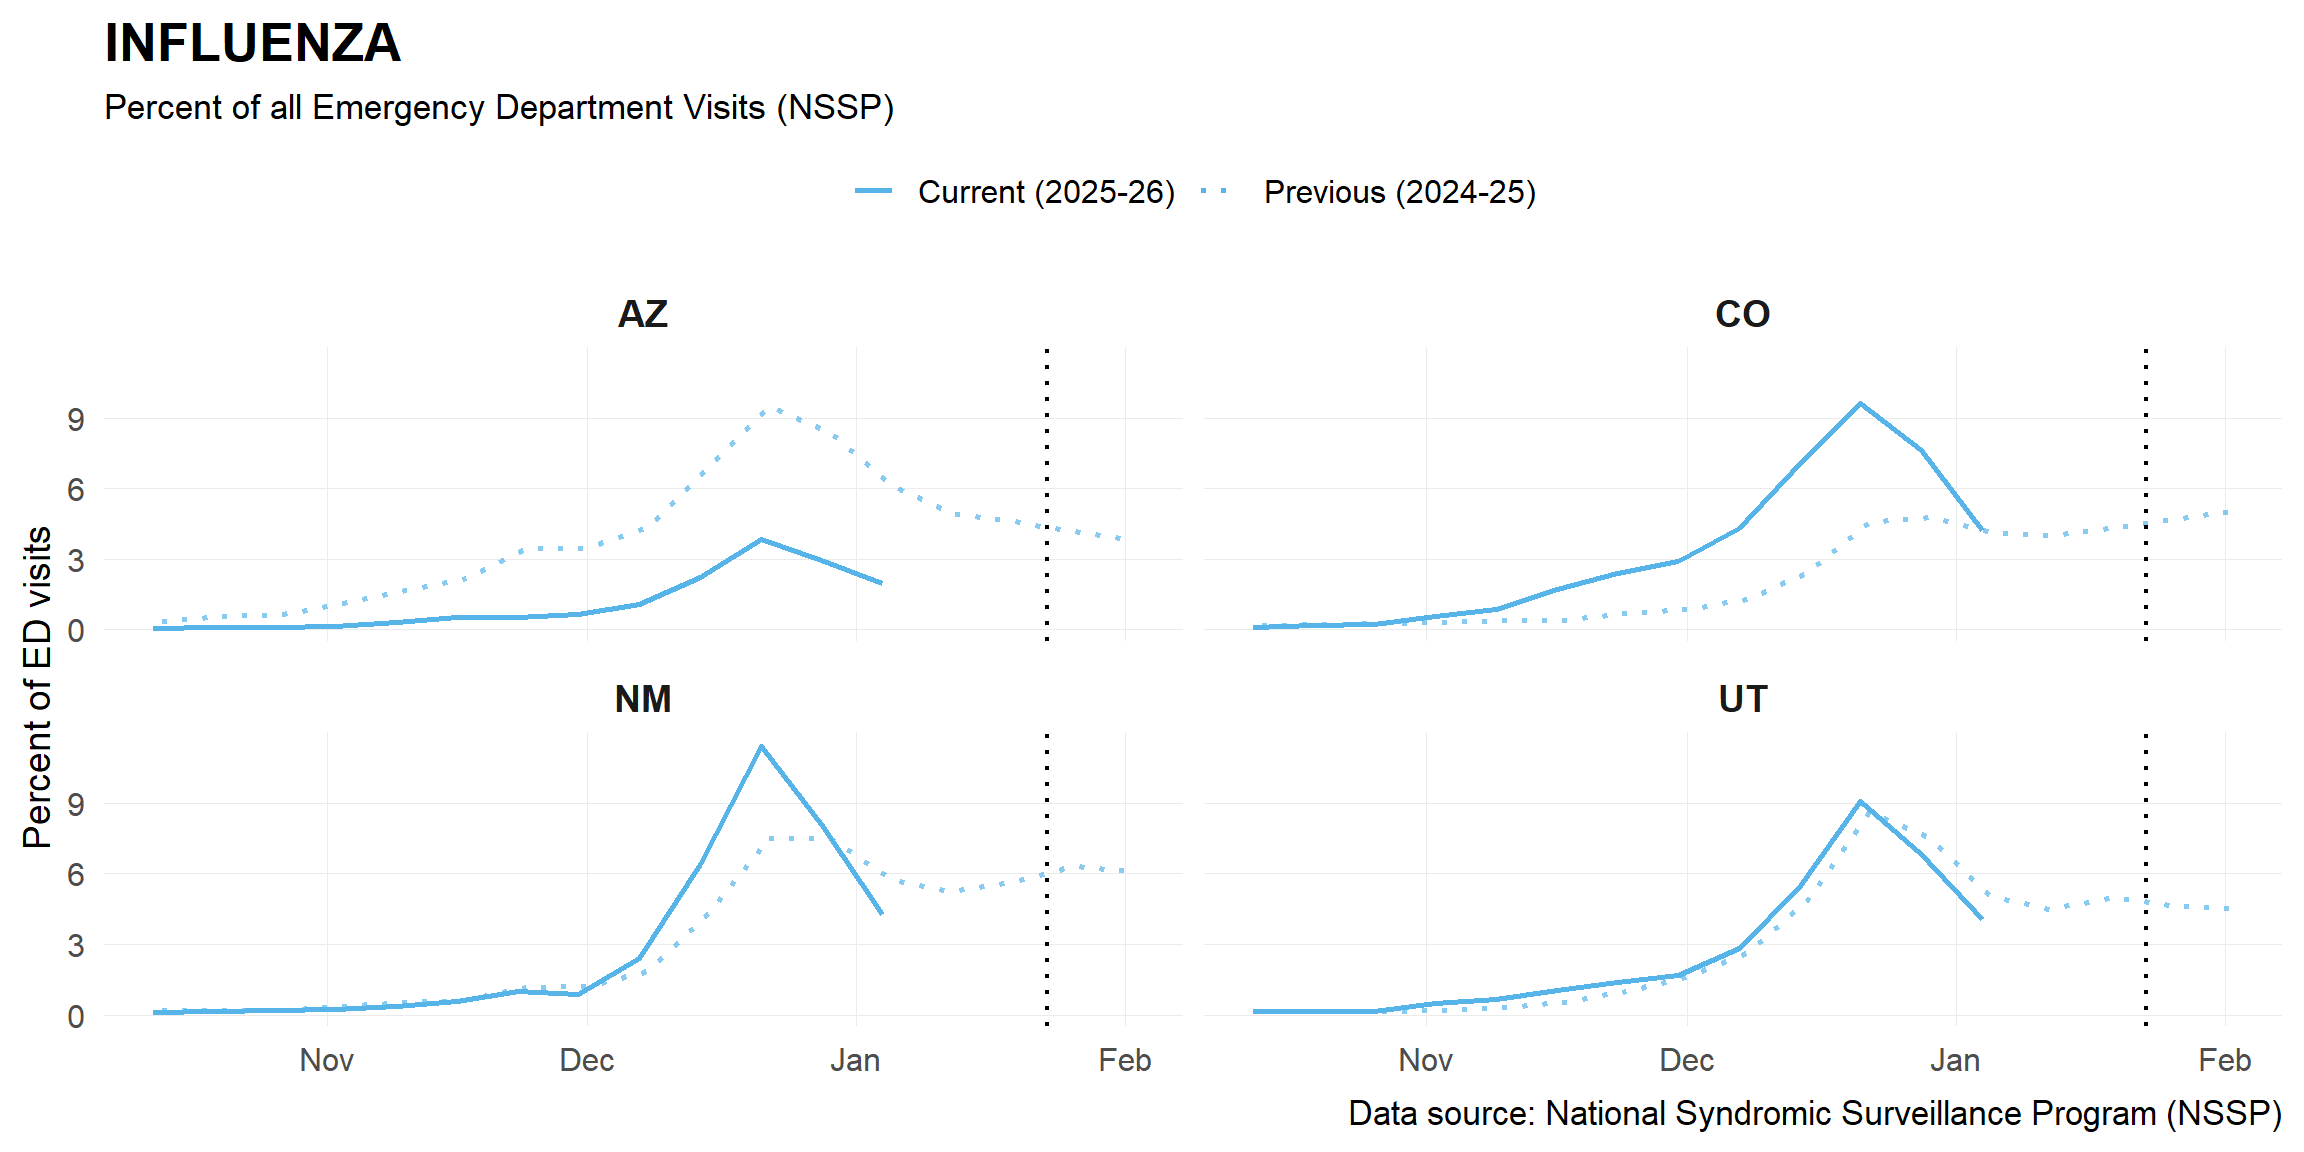
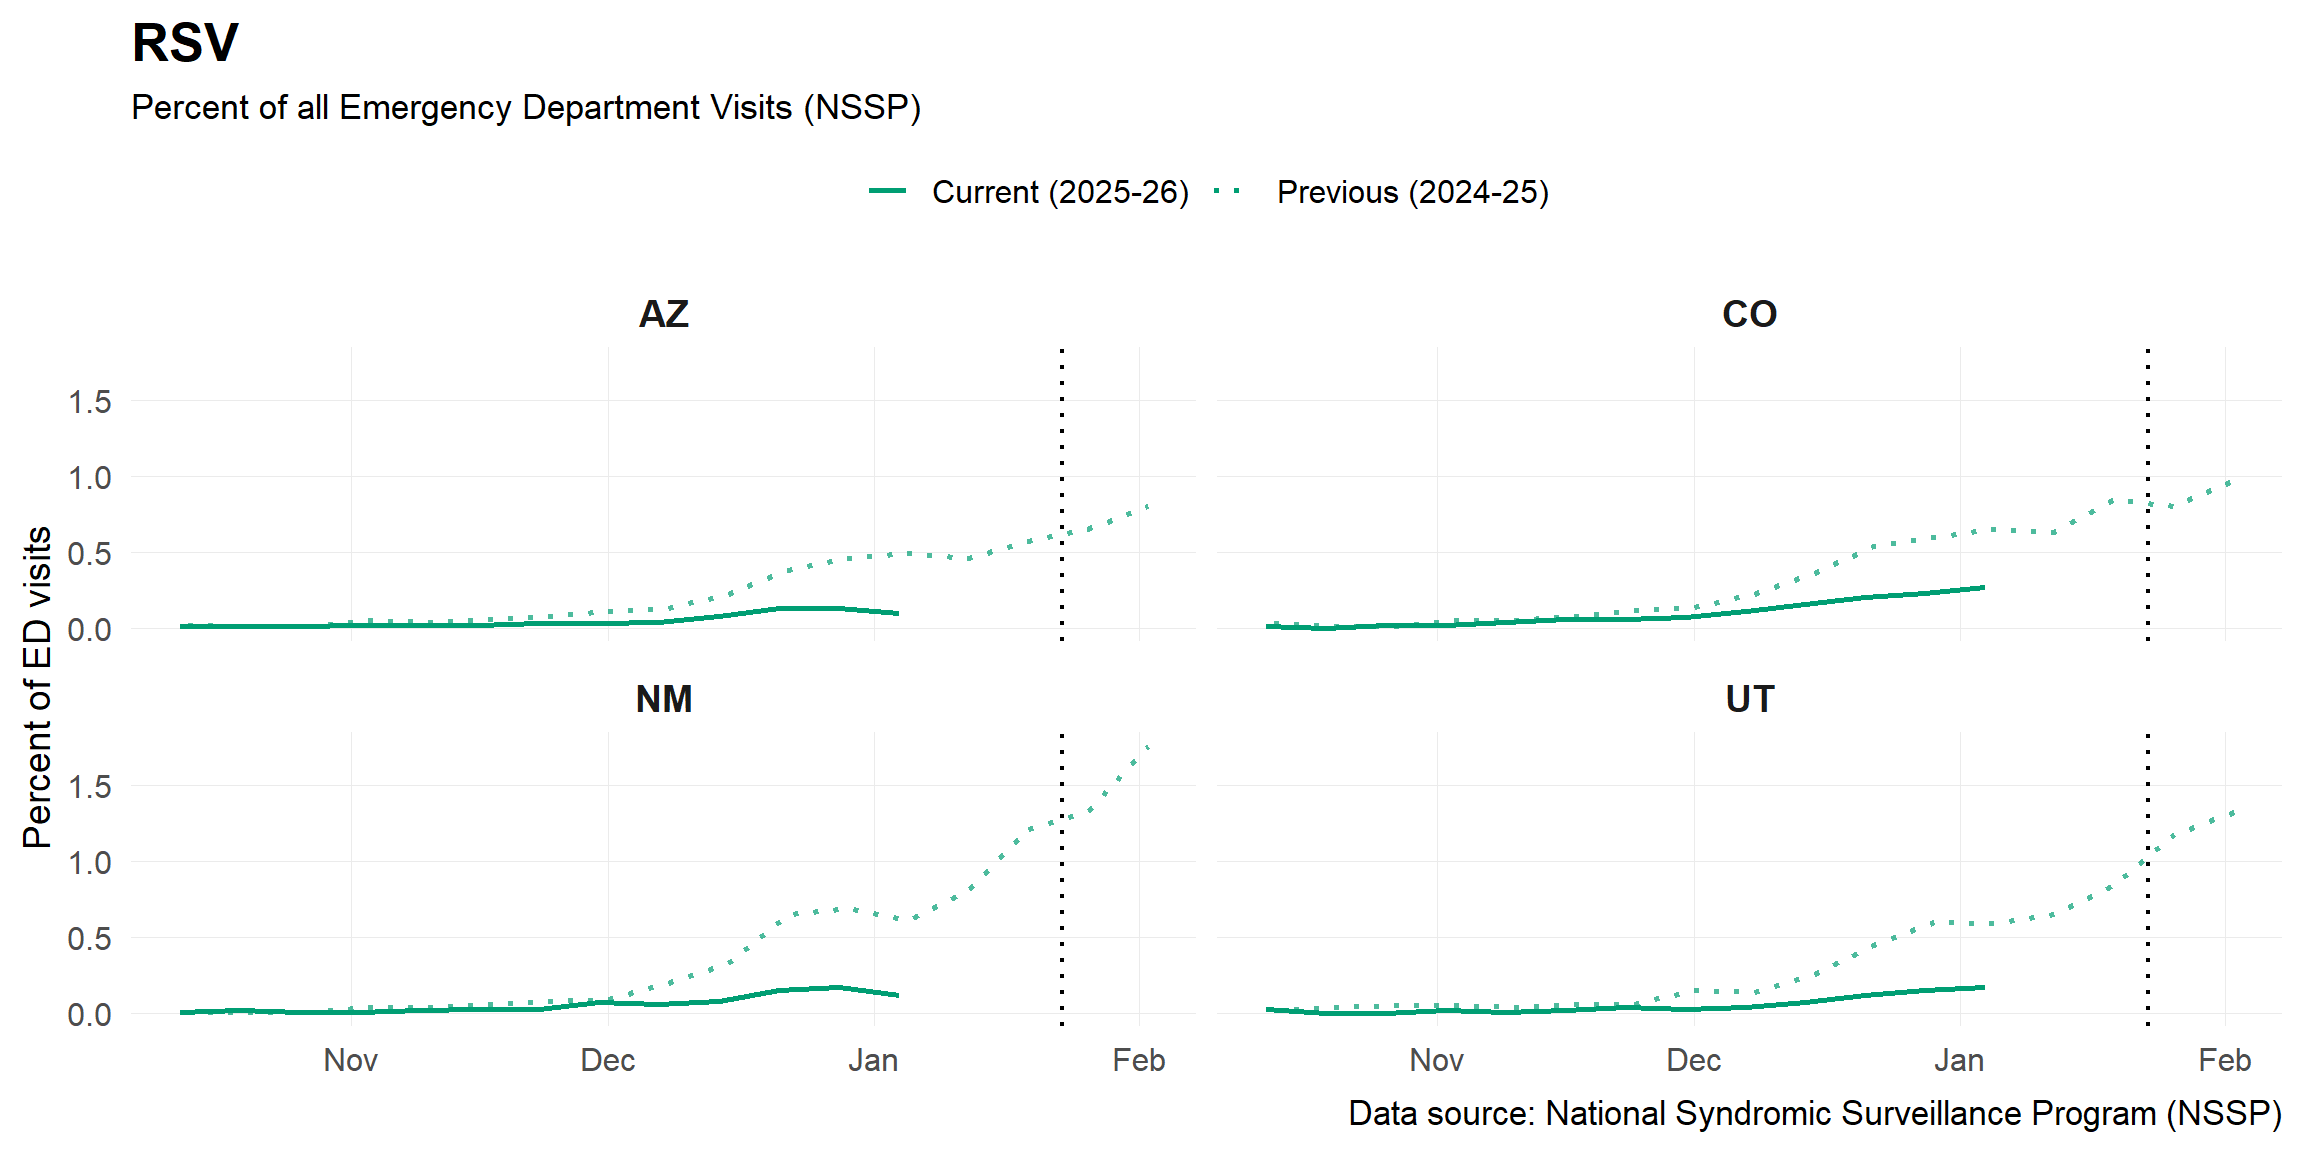
This figure shows the state-level trends in the impact of respiratory virus activity on emergency department (ED) visits based on National Syndromic Surveillance Program (NSSP) data. The broad coverage of this emergency department sample helps to provide reasonable estimates of how much symptomatic illness each virus is causing in each state. The percentage of visits for each disease out of all ED visits is shown to allow comparability across time and across states despite different overall ED visit volume. Data from the previous season, represented with dotted lines, are also shown for comparison. The dashed black vertical line represents the current report date, but the most updated available data may not be as recent.
Forecasts:
Forecasts are not yet available for emergency department visits.


