B6: completed saved-forecast ensemble checks
7 October 2026. No models were retrained for these comparisons. CPU Slurm job 4128575 combined twelve saved-forecast groups by two rules and used the common pilot scorer. The new five-seed training campaign is separate.
A is the width-96 sampled MLP with Kinsa, trained on artificially degraded histories corrected by trees learned from real report-to-mature pairs. B is the width-96 direct-quantile MLP with neighbor exchange and no extra covariates, trained with artificial reporting errors and recent-observation reconstruction. Both learn finalized future flu admissions and ED labels. The changed B uses actual archived training reports (finalized fallback when absent) instead of artificial error draws, retaining its finalized future and reconstruction labels.
Every model trained on 2022–23/2023–24/2024–25 to evaluate 2025–26, and separately on 2022–23/2023–24/2025–26 to evaluate 2024–25. These seasons have been reused for development. Evaluation uses reported histories with finalized fills where no archive exists, correction of the newest two admission weeks, and reported ED. Each recipe receives equal ensemble weight, then each seed within it receives equal weight. Combining models is not retraining them.
Relative WIS compares with the frozen Hub ensemble, lower is better, 1 is parity. States/DC receive 80% of geographic weight, US 20%; seasons are equally weighted. The combined score uses admissions weight 1 and ED weight 0.5; 2024–25 has no frozen ED support, so that season's contribution is admissions only.
Actual archived training reports
Same seeds 44/45 for every recipe in this table; quantile averaging.
| Model training treatment | Combined native | Admissions native | Admissions log |
|---|---|---|---|
| Original A + original B | 0.792129 | 0.786285 | 0.816382 |
| Original A + B trained on actual reports | 0.776406 | 0.768116 | 0.812793 |
| A using half actual reports + original B | 0.787835 | 0.779889 | 0.829520 |
| A using half actual reports + B using all actual reports | 0.775736 | 0.767298 | 0.835926 |
Changing B improves all three aggregate scores, including about 2% on the combined native score. Changing A as well slightly improves native admissions but worsens log admissions. Keep original A while completing five-seed evidence for B trained on actual reports. This two-seed result does not yet finalize the production replacement.
Five versus seven seeds
Original A/B training treatments, equal-recipe quantile averaging, same folds and evaluation inputs as above.
| Seeds per recipe | Combined native | Admissions native | Admissions log |
|---|---|---|---|
| Five: 44–48 | 0.794796 | 0.795393 | 0.802592 |
| Seven: 42–48 | 0.774653 | 0.773134 | 0.786221 |
| Five: 42–46 | 0.763933 | 0.760463 | 0.779113 |
| Five: 43–47 | 0.783206 | 0.783100 | 0.790635 |
Seven beats the original five, but one five-seed subset beats seven. Original selection used seeds 42/43, so their addition is confounded with selection luck. This motivates ten production seeds where affordable; it does not establish a guaranteed gain from increasing the count. Do not choose a lucky seed subset for production based on these tables.
Averaging versus mixtures
For original seven-seed A+B, mixing changes combined native WIS from 0.774653 to 0.773854 and log admissions from 0.786221 to 0.792794. For A+B with actual-report training for B on seeds 44/45, mixing changes combined native from 0.776406 to 0.775253 and log admissions from 0.812793 to 0.819474. Thus small native gains come with somewhat worse log scores. Coverage and per-season/horizon comparisons remain part of the final decision.
These mixtures reconstruct inverse CDFs by interpolating the saved 23 quantiles, with constant endpoint tails. They are not recovered original sampled paths and do not establish joint trajectory calibration. Direct-quantile B has no uniquely specified full distribution outside those quantiles.
Exact tables: rankings and per-seed/season/target scores. On Longleaf, the output directory additionally retains group membership and distribution diagnostics. No figures have been visually inspected.
Commands used in the B6 checkout:
The scorer is chromantis.experiment.pilot.rank_pilot, also used by the shared
manager. Research plan/launch/status/rank commands are in the
campaign plan.
Coverage diagnostics added at 12:25 EDT
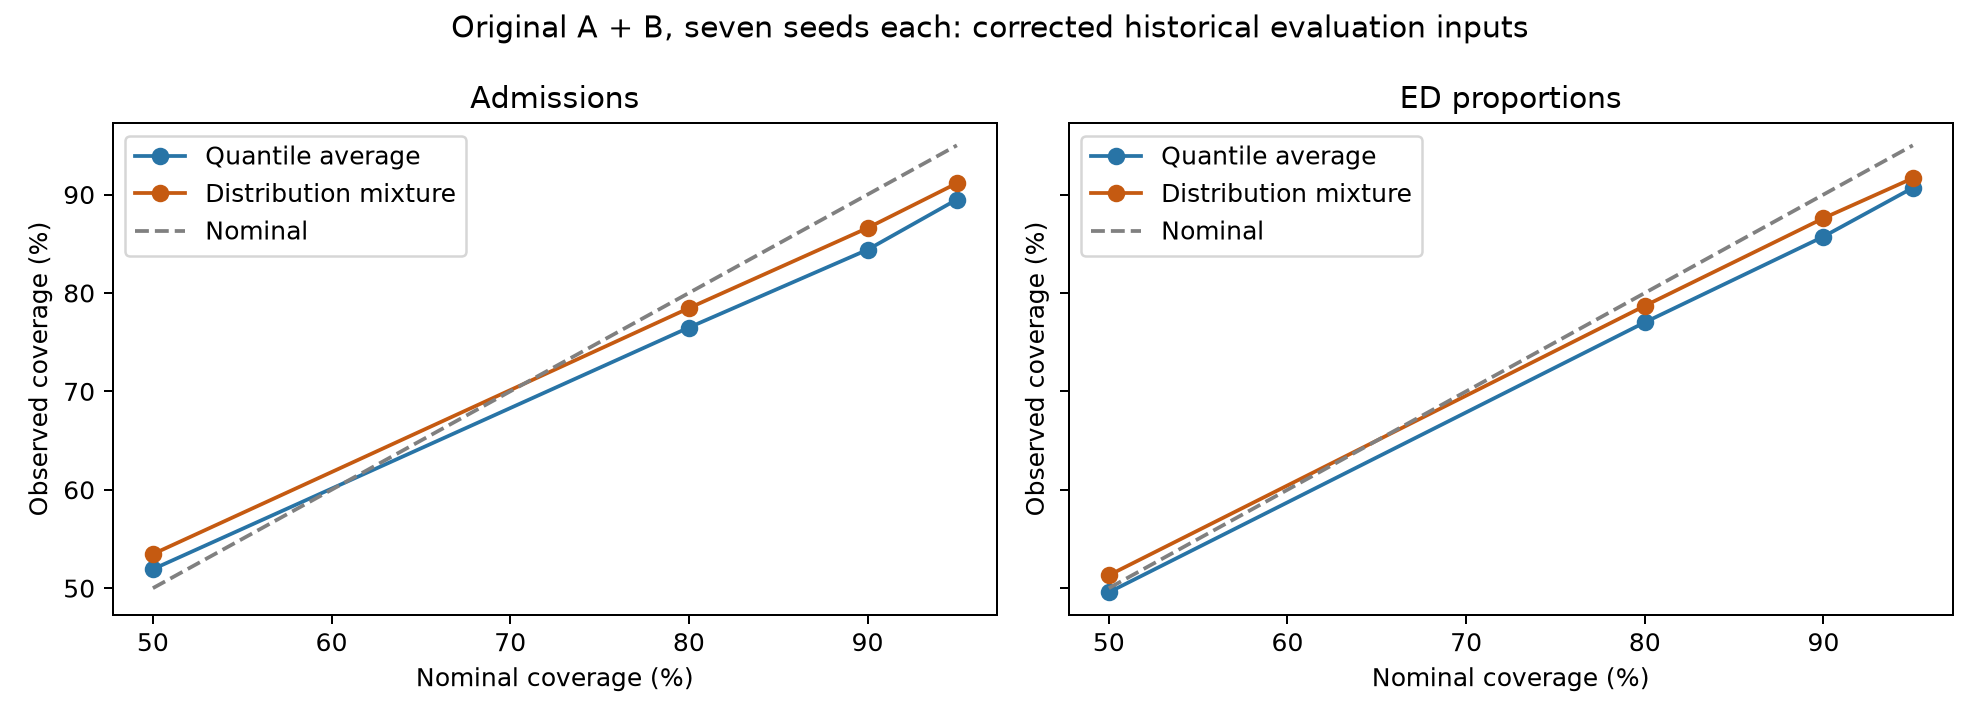
For the original A and B defined above, trained on the two three-season folds with finalized future labels and evaluated on corrected reported histories in 2024–25 and 2025–26, the seven-seed ensemble gives these interval coverages:
| Prediction target / rule | Nominal 80% | Nominal 95% |
|---|---|---|
| Admissions, quantile average | 76.49% | 89.50% |
| Admissions, interpolated distribution mixture | 78.46% | 91.15% |
| ED proportions, quantile average | 77.01% | 90.68% |
| ED proportions, interpolated distribution mixture | 78.69% | 91.66% |
These diagnostics include all saved four-week windows with complete labels per location, not just the frozen Hub task support used for relative WIS. Each state's coverage is averaged equally within the state/DC 80% weight; US receives 20%, and both seasons receive equal weight. Higher coverage is helpful while below nominal, but coverage alone does not measure sharpness. The mixtures improve coverage while still under-covering at 95%; the slightly worse log WIS remains a real tradeoff.
Coverage graph, season-specific coverage, and equal-season coverage. The graph was generated with Matplotlib without visual inspection, using the already-computed distribution scores; no additional training or scoring job was launched for this summary.