Completed output-head comparison
All 16 research runs (8 configurations × seeds 42/43) completed successfully at 09:43:35 EDT on October 6. Eight short validation runs passed first. Common-manager ranking: ranking-63f2eff0ea53. The feature encoder is held fixed: these are output-head comparisons, not four different feature encoders. Exact design and manager commands.
Conditions and interpretation
Recipe A: width-96 joint flu MLP using flu admissions/ED histories and Kinsa. Its training histories receive synthetic reporting errors followed by cross-fitted corrections from trees fitted to real archived report-to-mature pairs. Prediction labels are finalized next-four-week flu admissions and ED.
Recipe B: width-96 joint flu MLP using flu histories without extra covariates, spatial neighbor exchange, artificial reporting errors during fitting, and auxiliary reconstruction of recent finalized flu observations. Future labels are the same finalized next-four-week outcomes. Other architecture, optimizer and input-transform settings stay fixed within each recipe when changing the output head.
Each variant is independently retrained on seeds 42/43. Forward: train 2022–23, 2023–24, 2024–25, evaluate 2025–26. Retrospective: train 2022–23, 2023–24, 2025–26, evaluate 2024–25. These evaluation seasons have informed development. The tables below use Wednesday/holiday reported evaluation histories with unavailable archives filled by final truth and the newest two admission weeks corrected by each recipe's tree; ED remains reported. Alternative reported-only and 50/50 forecast-mixture results are retained in labeled-summary.csv.
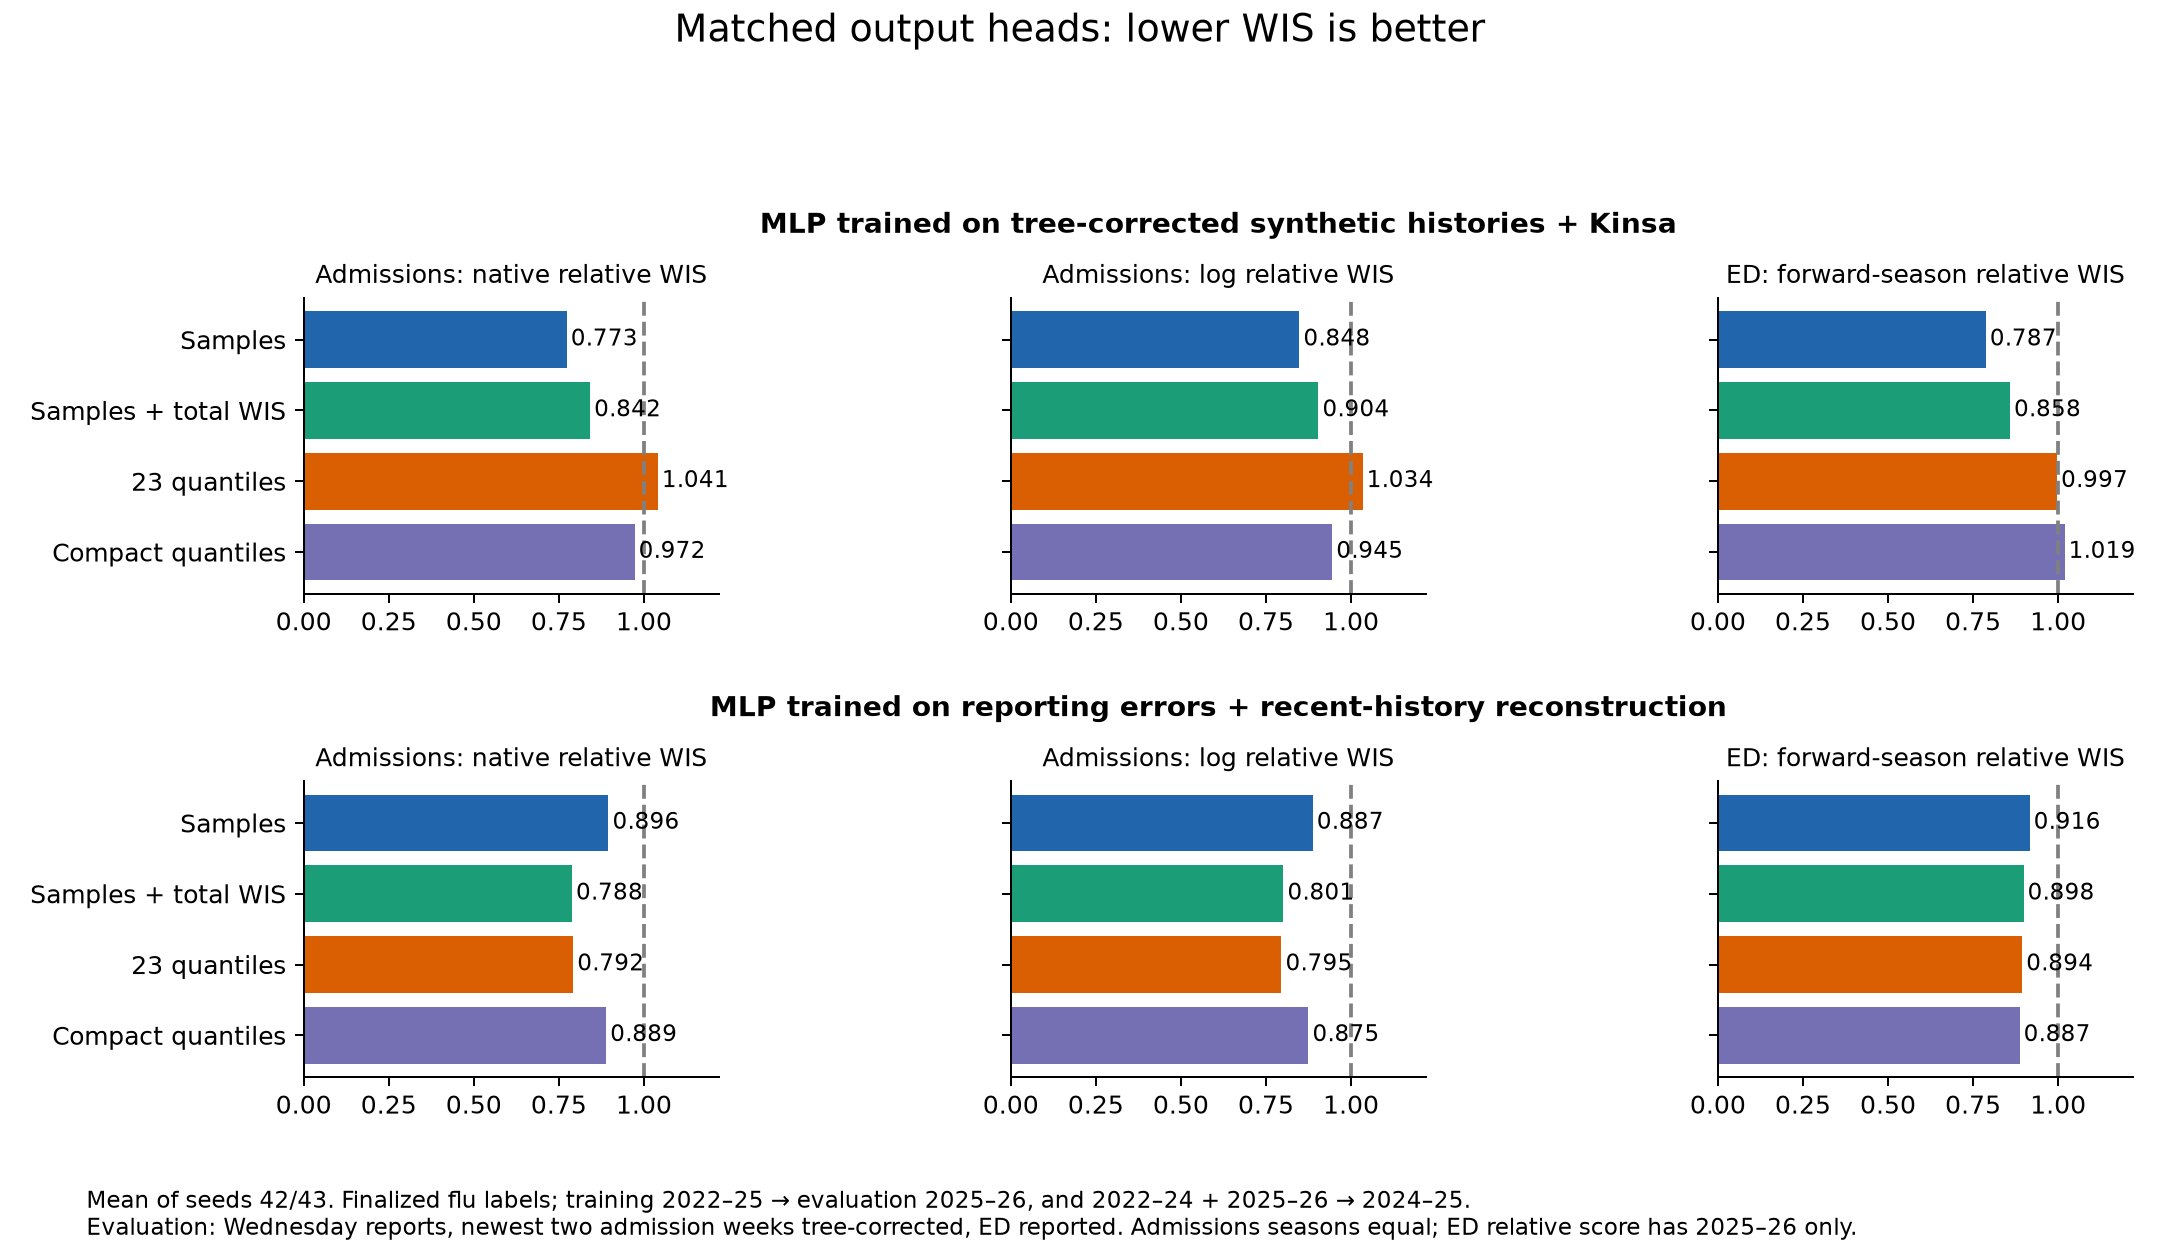
Marginal native/log admissions relative WIS averages both seasons equally, with states/DC 80% and US 20%. Lower is better, and 1 represents the frozen ensemble. The ED relative score covers only 2025–26 because frozen retrospective support lacks ED. Retrospective ED is separately checked with raw WIS. The composite likewise has only admissions in its retrospective half. Small differences from the previous leaders (roughly 0.0001–0.0007) reflect independent reruns/hardware numerics, not new substantive improvements.
Matched output heads
| Training recipe | Output head / added loss | Native admissions | Log admissions | Forward ED | Native composite |
|---|---|---|---|---|---|
| A: corrected synthetic histories + Kinsa | Samples, marginal fair CRPS | 0.7731 | 0.8481 | 0.7873 | 0.7804 |
| A | Samples + 0.25 total WIS | 0.8417 | 0.9040 | 0.8583 | 0.8485 |
| A | Current 23 ordered quantiles | 1.0407 | 1.0341 | 0.9967 | 1.0500 |
| A | Compact quantiles | 0.9725 | 0.9447 | 1.0189 | 0.9816 |
| B: reporting errors + reconstruction | Samples, marginal fair CRPS | 0.8957 | 0.8874 | 0.9161 | 0.8875 |
| B | Samples + 0.25 total WIS | 0.7883 | 0.8012 | 0.8982 | 0.7963 |
| B | Current 23 ordered quantiles | 0.7921 | 0.7955 | 0.8942 | 0.7959 |
| B | Compact quantiles | 0.8889 | 0.8747 | 0.8866 | 0.8882 |
Samples clearly remain best for recipe A. The degradation from adding total WIS appears in both seeds and both seasons. Recipe B prefers current direct quantiles, but adding total WIS to its sampled model closes almost all the gap: slightly better native admissions than quantiles, slightly worse log admissions and forward ED. Both seeds improve when adding total WIS to recipe B. This interaction contradicts a blanket “quantiles are better” or “sum WIS always helps” conclusion. Head-specific retuning was deliberately not done; recipe A was originally selected with samples and recipe B with quantiles.
Compact quantiles did not beat either original leader. On recipe B they slightly improve forward ED relative WIS (0.8866 vs 0.8942), but substantially worsen admissions and retrospective ED. Their marginal admission intervals also under-cover: weighted 95% coverage is 83.4% on B versus 91.3% for current quantiles, and 80.4% on A versus 85.5% for samples. The more restricted shared shape and its optimization may explain this; the experiment does not distinguish these mechanisms or rule out all compact families.
Four-week totals and coverage
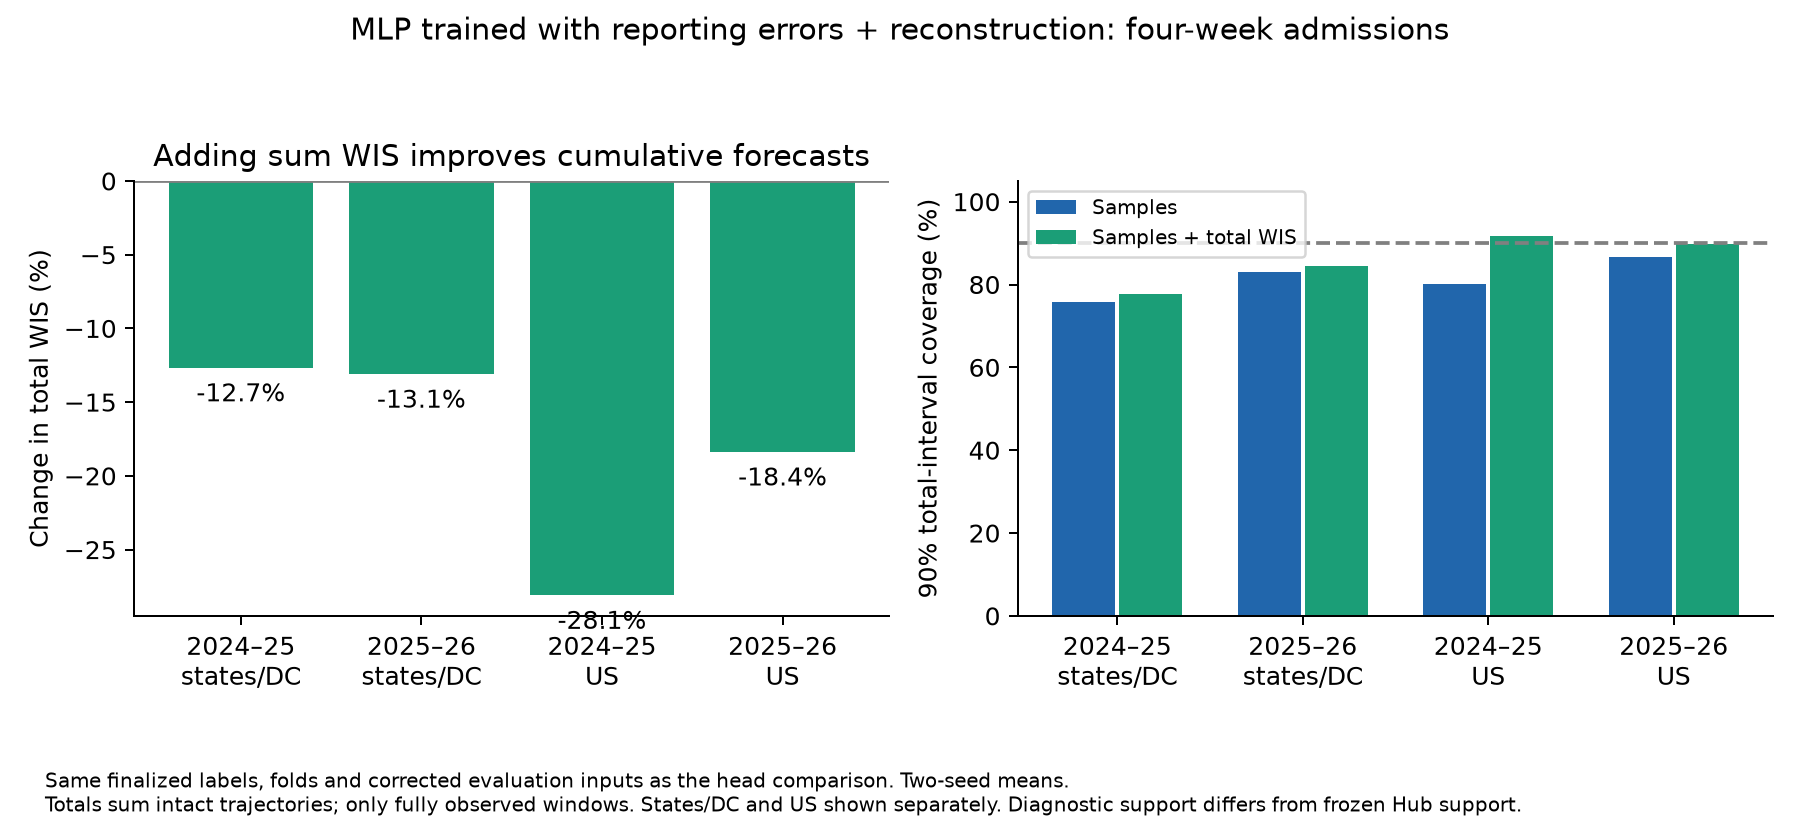
The sampled auxiliary objective computes 23-quantile WIS after summing intact four-week trajectories, with weight 0.25 and scale four times the training-only admission Q95. Early stopping still uses marginal future loss. The diagnostics use fully observed four-week windows over the saved evaluation episodes, a different support from frozen Hub tasks. Locations are first averaged within states/DC; national results are shown separately because raw WIS has different count scales. These are not ensemble-relative cumulative scores. Overlapping issuance windows are not independent replicates.
For recipe B, adding sum WIS improves two-seed mean cumulative WIS in both seasons and geographies:
| Evaluation season and geography | Samples: total WIS | Samples + total WIS: total WIS | Change | 90% total coverage, before → after |
|---|---|---|---|---|
| 2024–25 states/DC | 195.39 | 170.66 | −12.7% | 75.7% → 77.7% |
| 2025–26 states/DC | 125.76 | 109.30 | −13.1% | 82.9% → 84.5% |
| 2024–25 US | 8654.45 | 6223.40 | −28.1% | 80.2% → 91.7% |
| 2025–26 US | 6135.53 | 5008.63 | −18.4% | 86.7% → 89.8% |
This improves coverage, but states/DC still fall short of 90%. The gain is not universal at seed level: seed 42 in 2025–26 has about 2% worse total WIS in both geographies, while seed 43 improves strongly. With only two seeds, do not treat the mean gains as precisely estimated.
For recipe A, the same added objective worsens cumulative WIS in both seasons and geographies (roughly +10–20% in two-seed means), and all eight season × seed × geography comparisons are worse. Weighted 90% cumulative coverage falls from 80.2% to 74.9%. Keep the original sampled loss for A.
Direct marginal quantiles do not identify the distribution of a sum, so their cumulative WIS and coverage are intentionally absent. We also calculate the probability that all four observed weeks lie inside their respective marginal intervals. This rectangular simultaneous-coverage diagnostic is not a nominally calibrated joint interval; 90% per-week intervals are not expected to imply 90% simultaneous coverage.
ED in both seasons
Full-window raw ED WIS (states/DC; US) on 2024–25 / 2025–26:
- Recipe A samples: 0.006033; 0.005164 / 0.005071; 0.004074. Adding total WIS worsens all four to 0.006507; 0.005746 / 0.005503; 0.004565.
- Recipe B current quantiles: 0.005720; 0.004959 / 0.005713; 0.005057. Samples + total WIS: 0.005988; 0.005050 / 0.005804; 0.004896. Thus the sampled cumulative candidate is slightly worse for retrospective ED and forward states/DC, but better for forward US ED. It does not dominate direct quantiles.
Recommendation
Retain A with its original sampled loss for the strongest native admissions/forward ED performance. Retain B with current direct quantiles for strongest log admissions. Retain B with sampled forecasts plus total WIS as the most promising additional candidate when coherent cumulative admission uncertainty matters. Do not replace all heads with compact quantiles or apply total WIS indiscriminately. More seeds, targeted weight tuning or a different shape family are possible subsequent experiments, not yet launched or authorized by this analysis.
Files: labeled-summary.csv (two-seed means), labeled-seeds.csv (season and seed detail), distribution-geography.csv (separate-geography WIS and coverage), distribution-summary.csv (equal-season, 80/20 geography-weighted coverage only), pilot-raw-wis.csv (both-season ED), and distribution-scores.csv (location-level diagnostics). Figures are available as PNG and PDF. Reproduction: scripts/analyze_b4_followups.py and scripts/plot_b4_followups.py.