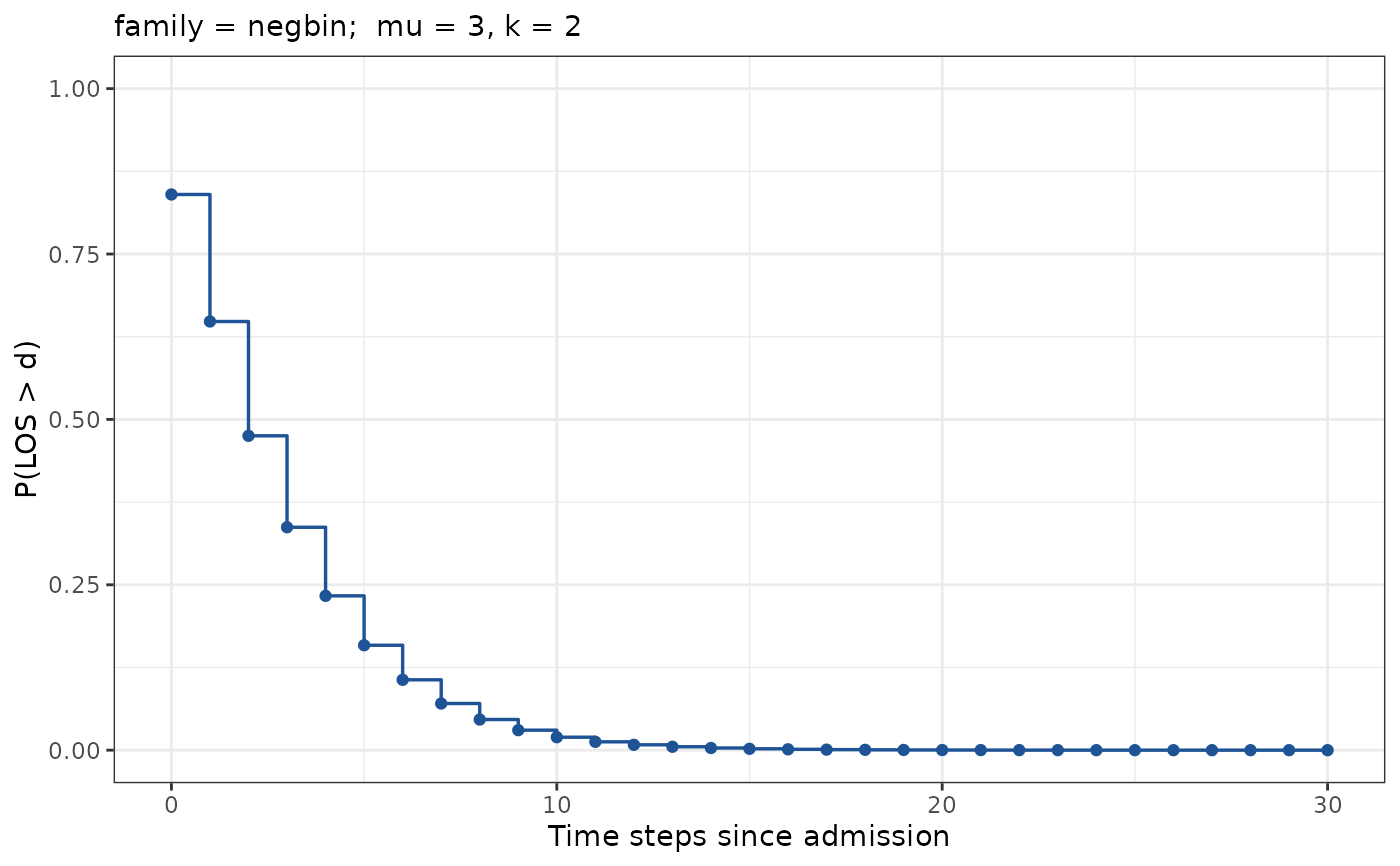
Renders the recovered survival curve P(LOS > d) for
d = 0..max_stay as a step line, with the family and fitted
parameters shown as a subtitle. Useful for sanity checking a
fit_los() result before passing it to fcast_census().
Usage
# S3 method for class 'los_fit'
plot(x, ...)
Arguments
- x
A
los_fitobject fromfit_los().- ...
Unused, present for S3 generic consistency.
Examples
set.seed(1)
true_surv <- spec_los("negbin", mu = 3, k = 2, max_stay = 30)
admissions <- rpois(120, 20)
census <- stats::convolve(admissions, rev(true_surv), type = "open")[
  seq_along(admissions)
]
fit <- fit_los(
  data.frame(admissions = admissions, census = census),
  family = "negbin", max_stay = 30
)
plot(fit)